Coca Cola 2013 Annual Report Download - page 98
Download and view the complete annual report
Please find page 98 of the 2013 Coca Cola annual report below. You can navigate through the pages in the report by either clicking on the pages listed below, or by using the keyword search tool below to find specific information within the annual report.-
 1
1 -
2
-
3
-
4
-
5
-
6
-
7
-
8
-
9
-
10
-
11
-
12
-
13
-
14
-
15
-
16
-
17
-
18
-
19
-
20
-
21
-
22
-
23
-
24
-
25
-
26
-
27
-
28
-
29
-
30
-
31
-
32
-
33
-
34
-
35
-
36
-
37
-
38
-
39
-
40
-
41
-
42
-
43
-
44
-
45
-
46
-
47
-
48
-
49
-
50
-
51
-
52
-
53
-
54
-
55
-
56
-
57
-
58
-
59
-
60
-
61
-
62
-
63
-
64
-
65
-
66
-
67
-
68
-
69
-
70
-
71
-
72
-
73
-
74
-
75
-
76
-
77
-
78
-
79
-
80
-
81
-
82
-
83
-
84
-
85
-
86
-
87
-
 88
88 -
 89
89 -
 90
90 -
 91
91 -
 92
92 -
 93
93 -
 94
94 -
 95
95 -
 96
96 -
 97
97 -
 98
98 -
 99
99 -
 100
100 -
 101
101 -
 102
102 -
 103
103 -
 104
104 -
 105
105 -
 106
106 -
 107
107 -
 108
108 -
109
-
110
-
111
-
112
-
113
-
114
-
115
-
116
-
117
-
118
-
119
-
120
-
121
-
122
-
123
-
124
-
125
-
126
-
127
-
128
-
129
-
130
-
131
-
132
-
133
-
134
-
135
-
136
-
137
-
138
-
139
-
140
-
141
-
142
-
143
-
144
-
145
-
146
-
147
-
148
-
149
-
150
-
151
-
152
-
153
-
154
-
155
-
156
-
157
-
158
-
159
-
160
 |
 |

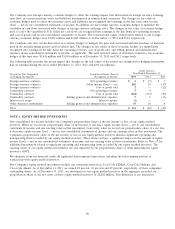
The Company uses foreign currency economic hedges to offset the earnings impact that fluctuations in foreign currency exchange
rates have on certain monetary assets and liabilities denominated in nonfunctional currencies. The changes in fair value of
economic hedges used to offset the monetary assets and liabilities are recognized into earnings in the line item other income
(loss) — net in our consolidated statements of income. In addition, we use foreign currency economic hedges to minimize the
variability in cash flows associated with changes in foreign currency exchange rates. The changes in fair value of economic hedges
used to offset the variability in U.S. dollar net cash flows are recognized into earnings in the line items net operating revenues
and cost of goods sold in our consolidated statements of income. The total notional values of derivatives related to our foreign
currency economic hedges were $3,871 million and $3,865 million as of December 31, 2013 and 2012, respectively.
The Company also uses certain derivatives as economic hedges to mitigate the price risk associated with the purchase of materials
used in the manufacturing process and for vehicle fuel. The changes in fair values of these economic hedges are immediately
recognized into earnings in the line items net operating revenues, cost of goods sold, and selling, general and administrative
expenses in our consolidated statements of income, as applicable. The total notional values of derivatives related to our economic
hedges of this type were $1,441 million and $1,084 million as of December 31, 2013 and 2012, respectively.
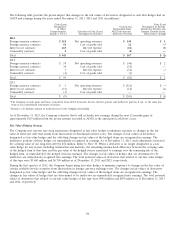
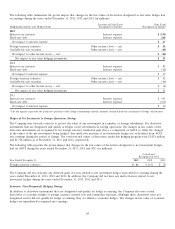
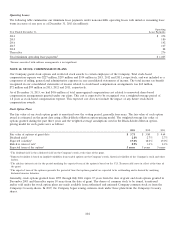
The following table presents the pretax impact that changes in the fair values of derivatives not designated as hedging instruments
had on earnings during the years ended December 31, 2013, 2012 and 2011 (in millions):
Gains (Losses)
Year Ended December 31,
Derivatives Not Designated Location of Gains (Losses)
as Hedging Instruments Recognized in Income 2013 2012 2011
Foreign currency contracts Net operating revenues $5 $(7) $ 7
Foreign currency contracts Other income (loss) — net 162 24 (37)
Foreign currency contracts Cost of goods sold 2— (12)
Commodity contracts Net operating revenues 54—
Commodity contracts Cost of goods sold (122) (110) (42)
Commodity contracts Selling, general and administrative expenses 79 (11)
Interest rate swaps Interest expense (3) ——
Other derivative instruments Selling, general and administrative expenses 55 18 8
Total $ 111 $ (62) $ (87)
NOTE 6: EQUITY METHOD INVESTMENTS
Our consolidated net income includes our Company’s proportionate share of the net income or loss of our equity method
investees. When we record our proportionate share of net income, it increases equity income (loss) — net in our consolidated
statements of income and our carrying value in that investment. Conversely, when we record our proportionate share of a net loss,
it decreases equity income (loss) — net in our consolidated statements of income and our carrying value in that investment. The
Company’s proportionate share of the net income or loss of our equity method investees includes significant operating and
nonoperating items recorded by our equity method investees. These items can have a significant impact on the amount of equity
income (loss) — net in our consolidated statements of income and our carrying value in those investments. Refer to Note 17 for
additional information related to significant operating and nonoperating items recorded by our equity method investees. The
carrying values of our equity method investments are also impacted by our proportionate share of items impacting the equity
investee’s AOCI.
We eliminate from our financial results all significant intercompany transactions, including the intercompany portion of
transactions with equity method investees.
The Company’s equity method investments include our ownership interests in Coca-Cola FEMSA, Coca-Cola Hellenic and
Coca-Cola Amatil. As of December 31, 2013, we owned 28 percent, 23 percent and 29 percent, respectively, of these companies’
outstanding shares. As of December 31, 2013, our investment in our equity method investees in the aggregate exceeded our
proportionate share of the net assets of these equity method investees by $2,202 million. This difference is not amortized.
96