Coca Cola 2013 Annual Report Download - page 114
Download and view the complete annual report
Please find page 114 of the 2013 Coca Cola annual report below. You can navigate through the pages in the report by either clicking on the pages listed below, or by using the keyword search tool below to find specific information within the annual report.-
 1
1 -
2
-
3
-
4
-
5
-
6
-
7
-
8
-
9
-
10
-
11
-
12
-
13
-
14
-
15
-
16
-
17
-
18
-
19
-
20
-
21
-
22
-
23
-
24
-
25
-
26
-
27
-
28
-
29
-
30
-
31
-
32
-
33
-
34
-
35
-
36
-
37
-
38
-
39
-
40
-
41
-
42
-
43
-
44
-
45
-
46
-
47
-
48
-
49
-
50
-
51
-
52
-
53
-
54
-
55
-
56
-
57
-
58
-
59
-
60
-
61
-
62
-
63
-
64
-
65
-
66
-
67
-
68
-
69
-
70
-
71
-
72
-
73
-
74
-
75
-
76
-
77
-
78
-
79
-
80
-
81
-
82
-
83
-
84
-
85
-
86
-
87
-
88
-
89
-
90
-
91
-
92
-
93
-
94
-
95
-
96
-
97
-
98
-
99
-
100
-
101
-
102
-
103
-
 104
104 -
 105
105 -
 106
106 -
 107
107 -
 108
108 -
 109
109 -
 110
110 -
 111
111 -
 112
112 -
 113
113 -
 114
114 -
 115
115 -
 116
116 -
 117
117 -
 118
118 -
 119
119 -
 120
120 -
 121
121 -
 122
122 -
 123
123 -
 124
124 -
125
-
126
-
127
-
128
-
129
-
130
-
131
-
132
-
133
-
134
-
135
-
136
-
137
-
138
-
139
-
140
-
141
-
142
-
143
-
144
-
145
-
146
-
147
-
148
-
149
-
150
-
151
-
152
-
153
-
154
-
155
-
156
-
157
-
158
-
159
-
160
 |
 |

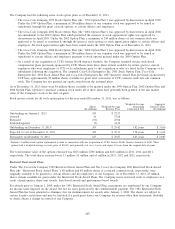
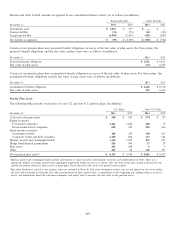
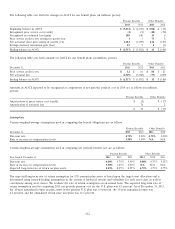
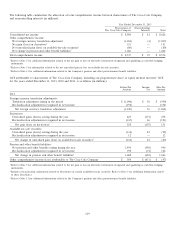
The following table sets forth the changes in AOCI for our benefit plans (in millions, pretax):
Pension Benefits Other Benefits
2013 2012 2013 2012
Beginning balance in AOCI $ (3,032) $ (2,169) $ (186) $ (34)
Recognized prior service cost (credit) (2) (2) (10) (52)
Recognized net actuarial loss (gain) 198 140 13 6
Prior service credit (cost) arising in current year 1373 2
Net actuarial (loss) gain arising in current year 1,283 (1,009) 122 (107)
Foreign currency translation gain (loss) 15 51(1)
Ending balance in AOCI $ (1,537) $ (3,032) $13$ (186)
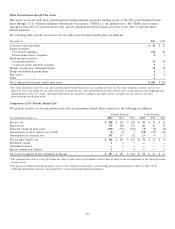
The following table sets forth amounts in AOCI for our benefit plans (in millions, pretax):
Pension Benefits Other Benefits
December 31, 2013 2012 2013 2012
Prior service credit (cost) $12$16$86$23
Net actuarial loss (1,549) (3,048) (73) (209)
Ending balance in AOCI $ (1,537) $ (3,032) $13$ (186)
Amounts in AOCI expected to be recognized as components of net periodic pension cost in 2014 are as follows (in millions,
pretax):
Pension Benefits Other Benefits
Amortization of prior service cost (credit) $ (2) $ (17)
Amortization of actuarial loss 76 2
$ 74 $ (15)
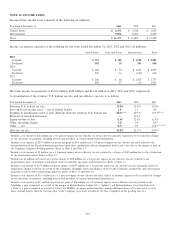
Assumptions
Certain weighted-average assumptions used in computing the benefit obligations are as follows:
Pension Benefits Other Benefits
December 31, 2013 2012 2013 2012
Discount rate 4.75% 4.00% 4.75% 4.00%
Rate of increase in compensation levels 3.50% 3.50% N/A N/A
Certain weighted-average assumptions used in computing net periodic benefit cost are as follows:
Pension Benefits Other Benefits
Year Ended December 31, 2013 2012 2011 2013 2012 2011
Discount rate 4.00% 4.75% 5.50% 4.00% 4.75% 5.25%
Rate of increase in compensation levels 3.50% 3.25% 4.00% N/A N/A N/A
Expected long-term rate of return on plan assets 8.25% 8.25% 8.25% 4.75% 4.75% 4.75%
The expected long-term rate of return assumption for U.S. pension plan assets is based upon the target asset allocation and is
determined using forward-looking assumptions in the context of historical returns and volatilities for each asset class, as well as
correlations among asset classes. We evaluate the rate of return assumption on an annual basis. The expected long-term rate of
return assumption used in computing 2013 net periodic pension cost for the U.S. plans was 8.5 percent. As of December 31, 2013,
the 10-year annualized return on plan assets in the primary U.S. plan was 6.9 percent, the 15-year annualized return was
6.2 percent, and the annualized return since inception was 11.1 percent.
112