Coca Cola 2013 Annual Report Download - page 59
Download and view the complete annual report
Please find page 59 of the 2013 Coca Cola annual report below. You can navigate through the pages in the report by either clicking on the pages listed below, or by using the keyword search tool below to find specific information within the annual report.-
 1
1 -
2
-
3
-
4
-
5
-
6
-
7
-
8
-
9
-
10
-
11
-
12
-
13
-
14
-
15
-
16
-
17
-
18
-
19
-
20
-
21
-
22
-
23
-
24
-
25
-
26
-
27
-
28
-
29
-
30
-
31
-
32
-
33
-
34
-
35
-
36
-
37
-
38
-
39
-
40
-
41
-
42
-
43
-
44
-
45
-
46
-
47
-
48
-
 49
49 -
 50
50 -
 51
51 -
 52
52 -
 53
53 -
 54
54 -
 55
55 -
 56
56 -
 57
57 -
 58
58 -
 59
59 -
 60
60 -
 61
61 -
 62
62 -
 63
63 -
 64
64 -
 65
65 -
 66
66 -
 67
67 -
 68
68 -
 69
69 -
70
-
71
-
72
-
73
-
74
-
75
-
76
-
77
-
78
-
79
-
80
-
81
-
82
-
83
-
84
-
85
-
86
-
87
-
88
-
89
-
90
-
91
-
92
-
93
-
94
-
95
-
96
-
97
-
98
-
99
-
100
-
101
-
102
-
103
-
104
-
105
-
106
-
107
-
108
-
109
-
110
-
111
-
112
-
113
-
114
-
115
-
116
-
117
-
118
-
119
-
120
-
121
-
122
-
123
-
124
-
125
-
126
-
127
-
128
-
129
-
130
-
131
-
132
-
133
-
134
-
135
-
136
-
137
-
138
-
139
-
140
-
141
-
142
-
143
-
144
-
145
-
146
-
147
-
148
-
149
-
150
-
151
-
152
-
153
-
154
-
155
-
156
-
157
-
158
-
159
-
160
 |
 |
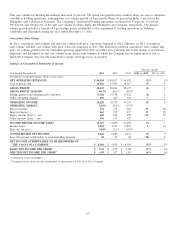
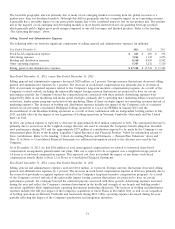
Interest Expense
Year Ended December 31, 2013, versus Year Ended December 31, 2012
Interest expense was $463 million in 2013, compared to $397 million in 2012, an increase of $66 million, or 17 percent. This
increase is primarily due to charges of $53 million the Company recorded on the early extinguishment of certain long-term debt,
as well as an overall higher average long-term debt balance in 2013. These charges include both the difference between the
reacquisition price and the net carrying amount of the debt extinguished as well as hedge accounting adjustments reclassified from
accumulated other comprehensive income to earnings. These increases were partially offset by the favorable impact of interest
rate swaps on our fixed-rate debt. Refer to Note 5 of Notes to Consolidated Financial Statements for additional information
related to the Company’s hedging program. Refer to the heading ‘‘Liquidity, Capital Resources and Financial Position — Cash
Flows from Financing Activities — Debt Financing’’ below for additional information related to the Company’s long-term debt
activity.
Year Ended December 31, 2012, versus Year Ended December 31, 2011
Interest expense was $397 million in 2012, compared to $417 million in 2011, a decrease of $20 million, or 5 percent. This
decrease reflects the impact of long-term debt maturities during the second quarter of 2012 and a net benefit related to interest
rate swaps on our fixed-rate debt, partially offset by the impact of additional long-term debt the Company issued during the first
quarter of 2012. Refer to Note 5 of Notes to Consolidated Financial Statements for additional information related to our interest
rate swaps. Refer to the heading ‘‘Liquidity, Capital Resources and Financial Position — Cash Flows from Financing Activities —
Debt Financing’’ below for additional information related to the Company’s long-term debt activity.
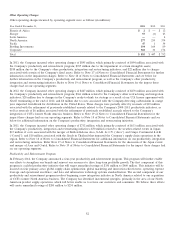
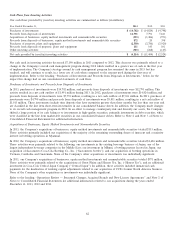
Equity Income (Loss) — Net
Year Ended December 31, 2013, versus Year Ended December 31, 2012
Equity income (loss) — net represents our Company’s proportionate share of net income or loss from each of our equity method
investees. In 2013, equity income was $602 million, compared to equity income of $819 million in 2012, a decrease of $217 million,
or 27 percent. This decrease reflects, among other items, the unfavorable impact of the challenging economic conditions around
the world where many of our equity method investees operate, the impact of unusual or infrequent charges recorded by certain of
our equity method investees and fluctuations in foreign currency exchange rates due to a stronger U.S. dollar against most major
currencies. Equity income (loss) — net was also impacted by the deconsolidation of our Philippine and Brazilian bottling
operations and the consolidation of innocent. Refer to Note 2 of Notes to Consolidated Financial Statements for additional
information about these transactions. Refer to Note 17 of Notes to Consolidated Financial Statements for additional information
related to the unusual or infrequent charges recorded by certain of our equity method investees.
Year Ended December 31, 2012, versus Year Ended December 31, 2011
In 2012, equity income was $819 million, compared to equity income of $690 million in 2011, an increase of $129 million, or
19 percent. This increase was primarily due to more favorable operating results reported by certain of our equity method
investees, a decrease in the impact of unusual or infrequent charges recorded by certain of our equity method investees, and the
Company’s acquisition of an equity ownership interest in Aujan during 2012, partially offset by the unfavorable impact of foreign
currency fluctuations. Refer to Note 17 of Notes to Consolidated Financial Statements for additional information related to the
unusual or infrequent charges recorded by certain of our equity method investees.
57