Coca Cola 2013 Annual Report Download - page 111
Download and view the complete annual report
Please find page 111 of the 2013 Coca Cola annual report below. You can navigate through the pages in the report by either clicking on the pages listed below, or by using the keyword search tool below to find specific information within the annual report.-
 1
1 -
2
-
3
-
4
-
5
-
6
-
7
-
8
-
9
-
10
-
11
-
12
-
13
-
14
-
15
-
16
-
17
-
18
-
19
-
20
-
21
-
22
-
23
-
24
-
25
-
26
-
27
-
28
-
29
-
30
-
31
-
32
-
33
-
34
-
35
-
36
-
37
-
38
-
39
-
40
-
41
-
42
-
43
-
44
-
45
-
46
-
47
-
48
-
49
-
50
-
51
-
52
-
53
-
54
-
55
-
56
-
57
-
58
-
59
-
60
-
61
-
62
-
63
-
64
-
65
-
66
-
67
-
68
-
69
-
70
-
71
-
72
-
73
-
74
-
75
-
76
-
77
-
78
-
79
-
80
-
81
-
82
-
83
-
84
-
85
-
86
-
87
-
88
-
89
-
90
-
91
-
92
-
93
-
94
-
95
-
96
-
97
-
98
-
99
-
100
-
 101
101 -
 102
102 -
 103
103 -
 104
104 -
 105
105 -
 106
106 -
 107
107 -
 108
108 -
 109
109 -
 110
110 -
 111
111 -
 112
112 -
 113
113 -
 114
114 -
 115
115 -
 116
116 -
 117
117 -
 118
118 -
 119
119 -
 120
120 -
 121
121 -
122
-
123
-
124
-
125
-
126
-
127
-
128
-
129
-
130
-
131
-
132
-
133
-
134
-
135
-
136
-
137
-
138
-
139
-
140
-
141
-
142
-
143
-
144
-
145
-
146
-
147
-
148
-
149
-
150
-
151
-
152
-
153
-
154
-
155
-
156
-
157
-
158
-
159
-
160
 |
 |

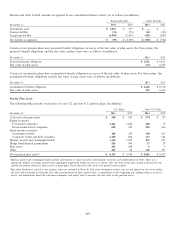
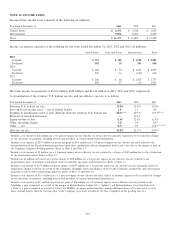
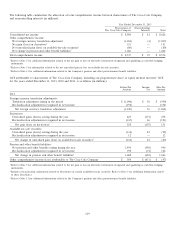
Pension and other benefit amounts recognized in our consolidated balance sheets are as follows (in millions):
Pension Benefits Other Benefits
December 31, 2013 2012 2013 2012
Noncurrent asset $ 1,067 $ 395 $— $—
Current liability (76) (73) (21) (21)
Long-term liability (1,090) (2,431) (682) (881)
Net liability recognized $ (99) $ (2,109) $ (703) $ (902)
Certain of our pension plans have projected benefit obligations in excess of the fair value of plan assets. For these plans, the
projected benefit obligations and the fair value of plan assets were as follows (in millions):
December 31, 2013 2012
Projected benefit obligation $ 1,521 $ 9,161
Fair value of plan assets 374 6,659
Certain of our pension plans have accumulated benefit obligations in excess of the fair value of plan assets. For these plans, the
accumulated benefit obligations and the fair value of plan assets were as follows (in millions):
December 31, 2013 2012
Accumulated benefit obligation $ 1,446 $ 8,736
Fair value of plan assets 351 6,546
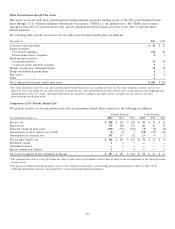
Pension Plan Assets
The following table presents total assets for our U.S. and non-U.S. pension plans (in millions):
U.S. Plans Non-U.S. Plans
December 31, 2013 2012 2013 2012
Cash and cash equivalents $ 240 $ 299 $ 274 $87
Equity securities:
U.S.-based companies 1,422 1,844 280 37
International-based companies 698 324 586 640
Fixed-income securities:
Government bonds 464 399 304 163
Corporate bonds and debt securities 1,369 856 137 126
Mutual, pooled and commingled funds11,134 1,057 453 453
Hedge funds/limited partnerships 526 496 17 29
Real estate 245 248 69
Other 245 26 346 491
Total pension plan assets2$ 6,343 $ 5,549 $ 2,403 $ 2,035
1Mutual, pooled and commingled funds include investments in equity securities, fixed-income securities and combinations of both. There are a
significant number of mutual, pooled and commingled funds from which investors can choose. The selection of the type of fund is dictated by the
specific investment objectives and needs of a given plan. These objectives and needs vary greatly between plans.
2Fair value disclosures related to our pension assets are included in Note 16. Fair value disclosures include, but are not limited to, the levels within
the fair value hierarchy in which the fair value measurements in their entirety fall; a reconciliation of the beginning and ending balances of Level 3
assets; and information about the valuation techniques and inputs used to measure the fair value of our pension assets.
109