Coca Cola 2013 Annual Report Download - page 134
Download and view the complete annual report
Please find page 134 of the 2013 Coca Cola annual report below. You can navigate through the pages in the report by either clicking on the pages listed below, or by using the keyword search tool below to find specific information within the annual report.-
 1
1 -
2
-
3
-
4
-
5
-
6
-
7
-
8
-
9
-
10
-
11
-
12
-
13
-
14
-
15
-
16
-
17
-
18
-
19
-
20
-
21
-
22
-
23
-
24
-
25
-
26
-
27
-
28
-
29
-
30
-
31
-
32
-
33
-
34
-
35
-
36
-
37
-
38
-
39
-
40
-
41
-
42
-
43
-
44
-
45
-
46
-
47
-
48
-
49
-
50
-
51
-
52
-
53
-
54
-
55
-
56
-
57
-
58
-
59
-
60
-
61
-
62
-
63
-
64
-
65
-
66
-
67
-
68
-
69
-
70
-
71
-
72
-
73
-
74
-
75
-
76
-
77
-
78
-
79
-
80
-
81
-
82
-
83
-
84
-
85
-
86
-
87
-
88
-
89
-
90
-
91
-
92
-
93
-
94
-
95
-
96
-
97
-
98
-
99
-
100
-
101
-
102
-
103
-
104
-
105
-
106
-
107
-
108
-
109
-
110
-
111
-
112
-
113
-
114
-
115
-
116
-
117
-
118
-
119
-
120
-
121
-
122
-
123
-
 124
124 -
 125
125 -
 126
126 -
 127
127 -
 128
128 -
 129
129 -
 130
130 -
 131
131 -
 132
132 -
 133
133 -
 134
134 -
 135
135 -
 136
136 -
 137
137 -
 138
138 -
 139
139 -
 140
140 -
 141
141 -
 142
142 -
 143
143 -
 144
144 -
145
-
146
-
147
-
148
-
149
-
150
-
151
-
152
-
153
-
154
-
155
-
156
-
157
-
158
-
159
-
160
 |
 |

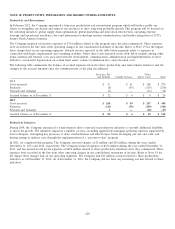
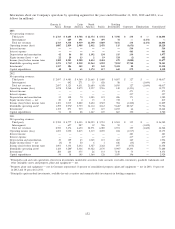
Information about our Company’s operations by operating segment for the years ended December 31, 2013, 2012 and 2011, is as
follows (in millions):
Eurasia & Latin North Bottling
Africa Europe America America Pacific Investments Corporate Eliminations Consolidated
2013
Net operating revenues:
Third party $ 2,763 $ 4,645 $ 4,748 $ 21,574 $ 5,372 $ 7,598 $ 154 $ — $ 46,854
Intersegment — 689 191 16 497 78 — (1,471) —
Total net revenues 2,763 5,334 4,939 21,590 5,869 7,676 154 (1,471) 46,854
Operating income (loss) 1,087 2,859 2,908 2,432 2,478 115 (1,651) — 10,228
Interest income — — — — — — 534 — 534
Interest expense — — — — — — 463 — 463
Depreciation and amortization 42 86 58 1,192 130 335 134 — 1,977
Equity income (loss) — net 22 24 13 2 19 524 (2) — 602
Income (loss) before income taxes 1,109 2,923 2,920 2,434 2,494 679 (1,082) — 11,477
Identifiable operating assets11,273 3,71322,918 33,964 1,922 7,011227,742 — 78,543
Investments31,157 106 545 49 143 9,424 88 — 11,512
Capital expenditures 40 34 63 1,374 117 643 279 — 2,550
2012
Net operating revenues:
Third party $ 2,697 $ 4,481 $ 4,560 $ 21,665 $ 5,680 $ 8,807 $ 127 $ — $ 48,017
Intersegment — 642 271 15 628 88 — (1,644) —
Total net revenues 2,697 5,123 4,831 21,680 6,308 8,895 127 (1,644) 48,017
Operating income (loss) 1,078 2,960 2,879 2,597 2,516 140 (1,391) — 10,779
Interest income — — — — — — 471 — 471
Interest expense — — — — — — 397 — 397
Depreciation and amortization 33 100 70 1,083 119 406 171 — 1,982
Equity income (loss) — net 20 45 4 13 2 732 3 — 819
Income (loss) before income taxes 1,101 3,015 2,882 2,624 2,523 904 (1,240) — 11,809
Identifiable operating assets11,299 2,97622,759 34,114 2,163 9,648222,767 — 75,726
Investments31,155 271 539 39 127 8,253 64 — 10,448
Capital expenditures 51 30 88 1,447 107 867 190 — 2,780
2011
Net operating revenues:
Third party $ 2,590 $ 4,777 $ 4,403 $ 20,559 $ 5,553 $ 8,501 $ 159 $ — $ 46,542
Intersegment — 697 287 12 536 90 — (1,622) —
Total net revenues 2,590 5,474 4,690 20,571 6,089 8,591 159 (1,622) 46,542
Operating income (loss) 1,003 3,090 2,815 2,319 2,239 224 (1,517) — 10,173
Interest income — — — — — — 483 — 483
Interest expense — — — — — — 417 — 417
Depreciation and amortization 30 109 63 1,065 115 403 169 — 1,954
Equity income (loss) — net (3) 33 20 6 1 646 (13) — 690
Income (loss) before income taxes 1,001 3,134 2,832 2,327 2,242 897 (975) — 11,458
Identifiable operating assets11,160 3,20422,446 33,422 2,170 8,905220,293 — 71,600
Investments3284 243 475 26 133 7,140 73 — 8,374
Capital expenditures 50 38 105 1,364 128 1,039 196 — 2,920
1Principally cash and cash equivalents, short-term investments, marketable securities, trade accounts receivable, inventories, goodwill, trademarks and
other intangible assets and property, plant and equipment — net.
2Property, plant and equipment — net in Germany represented 11 percent of consolidated property, plant and equipment — net in 2013, 10 percent
in 2012 and 10 percent in 2011.
3Principally equity method investments, available-for-sale securities and nonmarketable investments in bottling companies.
132