Coca Cola 2013 Annual Report Download - page 56
Download and view the complete annual report
Please find page 56 of the 2013 Coca Cola annual report below. You can navigate through the pages in the report by either clicking on the pages listed below, or by using the keyword search tool below to find specific information within the annual report.-
 1
1 -
2
-
3
-
4
-
5
-
6
-
7
-
8
-
9
-
10
-
11
-
12
-
13
-
14
-
15
-
16
-
17
-
18
-
19
-
20
-
21
-
22
-
23
-
24
-
25
-
26
-
27
-
28
-
29
-
30
-
31
-
32
-
33
-
34
-
35
-
36
-
37
-
38
-
39
-
40
-
41
-
42
-
43
-
44
-
45
-
 46
46 -
 47
47 -
 48
48 -
 49
49 -
 50
50 -
 51
51 -
 52
52 -
 53
53 -
 54
54 -
 55
55 -
 56
56 -
 57
57 -
 58
58 -
 59
59 -
 60
60 -
 61
61 -
 62
62 -
 63
63 -
 64
64 -
 65
65 -
 66
66 -
67
-
68
-
69
-
70
-
71
-
72
-
73
-
74
-
75
-
76
-
77
-
78
-
79
-
80
-
81
-
82
-
83
-
84
-
85
-
86
-
87
-
88
-
89
-
90
-
91
-
92
-
93
-
94
-
95
-
96
-
97
-
98
-
99
-
100
-
101
-
102
-
103
-
104
-
105
-
106
-
107
-
108
-
109
-
110
-
111
-
112
-
113
-
114
-
115
-
116
-
117
-
118
-
119
-
120
-
121
-
122
-
123
-
124
-
125
-
126
-
127
-
128
-
129
-
130
-
131
-
132
-
133
-
134
-
135
-
136
-
137
-
138
-
139
-
140
-
141
-
142
-
143
-
144
-
145
-
146
-
147
-
148
-
149
-
150
-
151
-
152
-
153
-
154
-
155
-
156
-
157
-
158
-
159
-
160
 |
 |

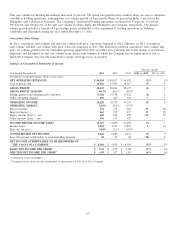
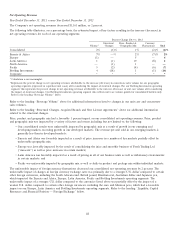
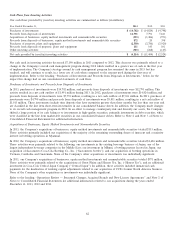
Operating Income and Operating Margin
Information about our operating income contribution by operating segment on a percentage basis is as follows:
Year Ended December 31, 2013 2012 2011
Eurasia & Africa 10.6% 10.0% 9.8%
Europe 28.0 27.5 30.4
Latin America 28.4 26.7 27.7
North America 23.8 24.1 22.8
Pacific 24.2 23.3 22.0
Bottling Investments 1.1 1.3 2.2
Corporate (16.1) (12.9) (14.9)
Total 100.0% 100.0% 100.0%
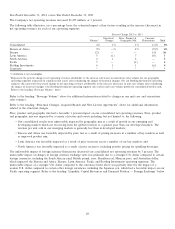
Information about our operating margin on a consolidated basis and by operating segment is as follows:
Year Ended December 31, 2013 2012 2011
Consolidated 21.8% 22.4% 21.9%
Eurasia & Africa 39.3% 40.0% 38.7%
Europe 61.5 66.1 64.7
Latin America 61.3 63.1 63.9
North America 11.3 12.0 11.3
Pacific 46.1 44.3 40.3
Bottling Investments 1.5 1.6 2.6
Corporate ***
* Calculation is not meaningful.
Year Ended December 31, 2013, versus Year Ended December 31, 2012
In 2013, foreign currency exchange rates unfavorably impacted consolidated operating income by 4 percent. The unfavorable
impact of changes in foreign currency exchange rates was primarily due to a stronger U.S. dollar compared to certain other
foreign currencies, including the South African rand, British pound, Brazilian real, Australian dollar and Japanese yen, which
impacted the Eurasia and Africa, Europe, Latin America, Pacific and Bottling Investments operating segments. The unfavorable
impact of a stronger U.S. dollar compared to the currencies listed above was partially offset by the impact of a weaker U.S. dollar
compared to certain other foreign currencies, including the euro and Mexican peso, which had a favorable impact on our Europe,
Latin America and Bottling Investments operating segments. Refer to the heading ‘‘Liquidity, Capital Resources and Financial
Position — Foreign Exchange’’ below.
Operating income for Eurasia and Africa for the years ended December 31, 2013 and 2012 was $1,087 million and $1,078 million,
respectively. In 2013, operating income was unfavorably impacted by fluctuations in foreign currency exchange rates by 8 percent.
The segment’s operating income was also favorably impacted by volume and revenue growth during 2013, partially offset by
continued investments in our brands and increased operating expenses.
Operating income for Europe for the years ended December 31, 2013 and 2012 was $2,859 million and $2,960 million,
respectively. In 2013, operating income was minimally impacted by fluctuations in foreign currency exchange rates. Operating
margin was unfavorably impacted by higher cost of goods sold and higher operating expenses due to the consolidation of the
innocent branded juice and smoothie business. Generally, bottling and finished product operations have higher net operating
revenues but lower operating margins when compared to concentrate and syrup operations. During 2013, operating income was
reduced by $57 million due to charges related to the Company’s productivity and reinvestment program.
54