Coca Cola 2013 Annual Report Download - page 125
Download and view the complete annual report
Please find page 125 of the 2013 Coca Cola annual report below. You can navigate through the pages in the report by either clicking on the pages listed below, or by using the keyword search tool below to find specific information within the annual report.-
 1
1 -
2
-
3
-
4
-
5
-
6
-
7
-
8
-
9
-
10
-
11
-
12
-
13
-
14
-
15
-
16
-
17
-
18
-
19
-
20
-
21
-
22
-
23
-
24
-
25
-
26
-
27
-
28
-
29
-
30
-
31
-
32
-
33
-
34
-
35
-
36
-
37
-
38
-
39
-
40
-
41
-
42
-
43
-
44
-
45
-
46
-
47
-
48
-
49
-
50
-
51
-
52
-
53
-
54
-
55
-
56
-
57
-
58
-
59
-
60
-
61
-
62
-
63
-
64
-
65
-
66
-
67
-
68
-
69
-
70
-
71
-
72
-
73
-
74
-
75
-
76
-
77
-
78
-
79
-
80
-
81
-
82
-
83
-
84
-
85
-
86
-
87
-
88
-
89
-
90
-
91
-
92
-
93
-
94
-
95
-
96
-
97
-
98
-
99
-
100
-
101
-
102
-
103
-
104
-
105
-
106
-
107
-
108
-
109
-
110
-
111
-
112
-
113
-
114
-
 115
115 -
 116
116 -
 117
117 -
 118
118 -
 119
119 -
 120
120 -
 121
121 -
 122
122 -
 123
123 -
 124
124 -
 125
125 -
 126
126 -
 127
127 -
 128
128 -
 129
129 -
 130
130 -
 131
131 -
 132
132 -
 133
133 -
 134
134 -
 135
135 -
136
-
137
-
138
-
139
-
140
-
141
-
142
-
143
-
144
-
145
-
146
-
147
-
148
-
149
-
150
-
151
-
152
-
153
-
154
-
155
-
156
-
157
-
158
-
159
-
160
 |
 |

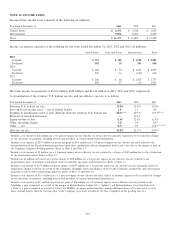
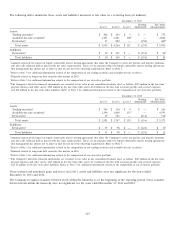
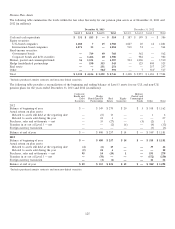
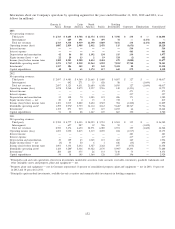
The following tables summarize those assets and liabilities measured at fair value on a recurring basis (in millions):
December 31, 2013
Netting Fair Value
Level 1 Level 2 Level 3 Adjustment1Measurements
Assets:
Trading securities2$ 206 $ 163 $ 3 $ — $ 372
Available-for-sale securities21,453 3,281 1083— 4,842
Derivatives417 822 — (150) 6895
Total assets $ 1,676 $ 4,266 $ 111 $ (150) $ 5,903
Liabilities:
Derivatives4$ 10 $ 165 $ — $ (151) $ 245
Total liabilities $ 10 $ 165 $ — $ (151) $ 24
1Amounts represent the impact of legally enforceable master netting agreements that allow the Company to settle net positive and negative positions
and also cash collateral held or placed with the same counterparties. There are no amounts subject to legally enforceable master netting agreements
that management has chosen not to offset or that do not meet the offsetting requirements. Refer to Note 5.
2Refer to Note 3 for additional information related to the composition of our trading securities and available-for-sale securities.
3Primarily related to long-term debt securities that mature in 2018.
4Refer to Note 5 for additional information related to the composition of our derivative portfolio.
5The Company’s derivative financial instruments are recorded at fair value in our consolidated balance sheet as follows: $129 million in the line item
prepaid expenses and other assets; $560 million in the line item other assets; $12 million in the line item accounts payable and accrued expenses;
and $12 million in the line item other liabilities. Refer to Note 5 for additional information related to the composition of our derivative portfolio.
December 31, 2012
Netting Fair Value
Level 1 Level 2 Level 3 Adjustment1Measurements
Assets:
Trading securities2$ 146 $ 116 $ 4 $ — $ 266
Available-for-sale securities21,390 3,068 1353— 4,593
Derivatives447 583 — (116) 5145
Total assets $ 1,583 $ 3,767 $ 139 $ (116) $ 5,373
Liabilities:
Derivatives4$ 35 $ 98 $ — $ (121) $ 125
Total liabilities $ 35 $ 98 $ — $ (121) $ 12
1Amounts represent the impact of legally enforceable master netting agreements that allow the Company to settle net positive and negative positions
and also cash collateral held or placed with the same counterparties. There are no amounts subject to legally enforceable master netting agreements
that management has chosen not to offset or that do not meet the offsetting requirements. Refer to Note 5.
2Refer to Note 3 for additional information related to the composition of our trading securities and available-for-sale securities.
3Primarily related to long-term debt securities that mature in 2018.
4Refer to Note 5 for additional information related to the composition of our derivative portfolio.
5The Company’s derivative financial instruments are recorded at fair value in our consolidated balance sheet as follows: $145 million in the line item
prepaid expenses and other assets; $369 million in the line item other assets; $11 million in the line item accounts payable and accrued expenses;
and $1 million in the line item other liabilities. Refer to Note 5 for additional information related to the composition of our derivative portfolio.
Gross realized and unrealized gains and losses on Level 3 assets and liabilities were not significant for the years ended
December 31, 2013 and 2012.
The Company recognizes transfers between levels within the hierarchy as of the beginning of the reporting period. Gross transfers
between levels within the hierarchy were not significant for the years ended December 31, 2013 and 2012.
123