Coca Cola 2013 Annual Report Download - page 52
Download and view the complete annual report
Please find page 52 of the 2013 Coca Cola annual report below. You can navigate through the pages in the report by either clicking on the pages listed below, or by using the keyword search tool below to find specific information within the annual report.-
 1
1 -
2
-
3
-
4
-
5
-
6
-
7
-
8
-
9
-
10
-
11
-
12
-
13
-
14
-
15
-
16
-
17
-
18
-
19
-
20
-
21
-
22
-
23
-
24
-
25
-
26
-
27
-
28
-
29
-
30
-
31
-
32
-
33
-
34
-
35
-
36
-
37
-
38
-
39
-
40
-
41
-
 42
42 -
 43
43 -
 44
44 -
 45
45 -
 46
46 -
 47
47 -
 48
48 -
 49
49 -
 50
50 -
 51
51 -
 52
52 -
 53
53 -
 54
54 -
 55
55 -
 56
56 -
 57
57 -
 58
58 -
 59
59 -
 60
60 -
 61
61 -
 62
62 -
63
-
64
-
65
-
66
-
67
-
68
-
69
-
70
-
71
-
72
-
73
-
74
-
75
-
76
-
77
-
78
-
79
-
80
-
81
-
82
-
83
-
84
-
85
-
86
-
87
-
88
-
89
-
90
-
91
-
92
-
93
-
94
-
95
-
96
-
97
-
98
-
99
-
100
-
101
-
102
-
103
-
104
-
105
-
106
-
107
-
108
-
109
-
110
-
111
-
112
-
113
-
114
-
115
-
116
-
117
-
118
-
119
-
120
-
121
-
122
-
123
-
124
-
125
-
126
-
127
-
128
-
129
-
130
-
131
-
132
-
133
-
134
-
135
-
136
-
137
-
138
-
139
-
140
-
141
-
142
-
143
-
144
-
145
-
146
-
147
-
148
-
149
-
150
-
151
-
152
-
153
-
154
-
155
-
156
-
157
-
158
-
159
-
160
 |
 |

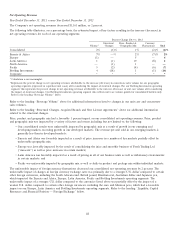
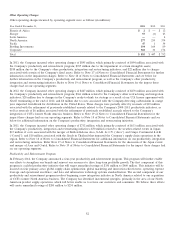
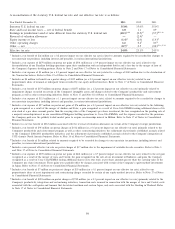
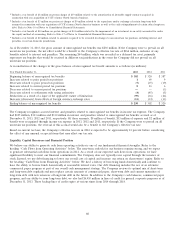
Net Operating Revenues by Operating Segment
Information about our net operating revenues by operating segment as a percentage of Company net operating revenues is as
follows:
Year Ended December 31, 2013 2012 2011
Eurasia & Africa 5.9% 5.6% 5.6%
Europe 9.9 9.3 10.3
Latin America 10.1 9.5 9.4
North America 46.1 45.1 44.2
Pacific 11.5 11.9 11.9
Bottling Investments 16.2 18.3 18.3
Corporate 0.3 0.3 0.3
100.0% 100.0% 100.0%
The percentage contribution of each operating segment fluctuates over time due to net operating revenues in certain operating
segments growing at a faster rate compared to other operating segments. Net operating revenue growth rates are impacted by
sales volume, structural changes, price and product/geographic mix, and foreign currency fluctuations. The size and timing of
structural changes are not consistent from period to period. As a result, anticipating the impact of such events on future net
operating revenues, and other financial statement line items, usually is not possible. We expect structural changes to have an
impact on our consolidated financial statements in future periods.
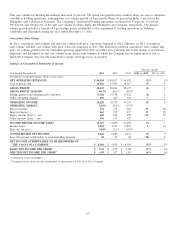
Gross Profit Margin
As a result of our finished goods operations, which are primarily included in our North America and Bottling Investments
operating segments, the following inputs represent a substantial portion of the Company’s total cost of goods sold: (1) sweeteners,
(2) metals, (3) juices and (4) PET. The Company increased our hedging activities related to certain commodities in order to
mitigate a portion of the price risk associated with forecasted purchases. Many of the derivative financial instruments used by the
Company to mitigate the risk associated with these commodity exposures, including any related foreign currency exposure, do not
qualify for hedge accounting. As a result, the changes in fair value of these derivative instruments have been, and will continue to
be, included as a component of net income in each reporting period. The Company recorded losses of $120 million, $110 million
and $54 million during the years ended December 31, 2013, 2012 and 2011, respectively, in the line item cost of goods sold in our
consolidated statements of income. Refer to Note 5 of Notes to Consolidated Financial Statements. We do not currently expect
changes in commodity costs to have a significant impact on our 2014 gross profit margin as compared to 2013.
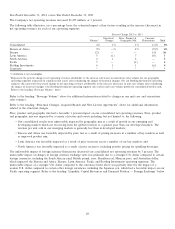
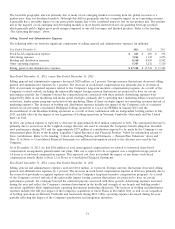
Year Ended December 31, 2013, versus Year Ended December 31, 2012
Our gross profit margin increased to 60.7 percent in 2013 from 60.3 percent in 2012. The increase is partially due to the
deconsolidation of our Philippine bottling operations in January 2013 and the deconsolidation of our Brazilian bottling operations
in July 2013. Refer to the heading ‘‘Structural Changes, Acquired Brands and New License Agreements’’ above for additional
information regarding the impact of the deconsolidation of our Philippine and Brazilian bottling operations.
Year Ended December 31, 2012, versus Year Ended December 31, 2011
Our gross profit margin decreased to 60.3 percent in 2012 from 60.9 percent in 2011. This decrease reflected the unfavorable
impact of continued increases in commodity costs during 2012 as well as temporary shifts in channel and package mix across
markets as a result of the impact of global economic conditions on consumers. In addition, our gross profit margin was
unfavorably impacted as a result of ongoing fluctuations in foreign currency exchange rates and the impact of our acquisition of
Great Plains in North America as well as our acquisition of bottling operations in Vietnam, Cambodia and Guatemala. The
impact of these items was partially offset by favorable geographic mix as well as price increases in many of our key markets.
The cost to purchase the inputs listed above continued to increase in 2012 when compared to 2011, and as a result the Company
incurred incremental costs of $225 million related to these inputs during 2012. Refer to Note 5 of Notes to Consolidated Financial
Statements for additional information regarding our commodity hedging activity.
50