Coca Cola 2013 Annual Report Download - page 58
Download and view the complete annual report
Please find page 58 of the 2013 Coca Cola annual report below. You can navigate through the pages in the report by either clicking on the pages listed below, or by using the keyword search tool below to find specific information within the annual report.-
 1
1 -
2
-
3
-
4
-
5
-
6
-
7
-
8
-
9
-
10
-
11
-
12
-
13
-
14
-
15
-
16
-
17
-
18
-
19
-
20
-
21
-
22
-
23
-
24
-
25
-
26
-
27
-
28
-
29
-
30
-
31
-
32
-
33
-
34
-
35
-
36
-
37
-
38
-
39
-
40
-
41
-
42
-
43
-
44
-
45
-
46
-
47
-
 48
48 -
 49
49 -
 50
50 -
 51
51 -
 52
52 -
 53
53 -
 54
54 -
 55
55 -
 56
56 -
 57
57 -
 58
58 -
 59
59 -
 60
60 -
 61
61 -
 62
62 -
 63
63 -
 64
64 -
 65
65 -
 66
66 -
 67
67 -
 68
68 -
69
-
70
-
71
-
72
-
73
-
74
-
75
-
76
-
77
-
78
-
79
-
80
-
81
-
82
-
83
-
84
-
85
-
86
-
87
-
88
-
89
-
90
-
91
-
92
-
93
-
94
-
95
-
96
-
97
-
98
-
99
-
100
-
101
-
102
-
103
-
104
-
105
-
106
-
107
-
108
-
109
-
110
-
111
-
112
-
113
-
114
-
115
-
116
-
117
-
118
-
119
-
120
-
121
-
122
-
123
-
124
-
125
-
126
-
127
-
128
-
129
-
130
-
131
-
132
-
133
-
134
-
135
-
136
-
137
-
138
-
139
-
140
-
141
-
142
-
143
-
144
-
145
-
146
-
147
-
148
-
149
-
150
-
151
-
152
-
153
-
154
-
155
-
156
-
157
-
158
-
159
-
160
 |
 |
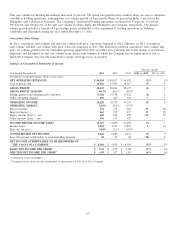
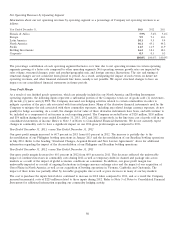
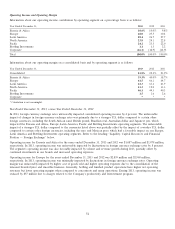
Operating income for Eurasia and Africa for the years ended December 31, 2012 and 2011 was $1,078 million and $1,003 million,
respectively. In 2012, operating income was unfavorably impacted by fluctuations in foreign currency exchange rates of 10 percent.
The unfavorable impact of the fluctuations in foreign currency exchange rates was offset by volume and revenue growth across the
operating segment.
Europe’s operating income for the years ended December 31, 2012 and 2011 was $2,960 million and $3,090 million, respectively.
In 2012, operating income was unfavorably impacted by fluctuations in foreign currency exchange rates by 4 percent. Operating
income also declined in 2012 as a result of lower sales volume and shifts in product, package and channel mix across the market
due to ongoing macroeconomic uncertainty and weak consumer confidence, partially offset by efficient expense management.
Operating income in Latin America for the years ended December 31, 2012 and 2011 was $2,879 million and $2,815 million,
respectively. In 2012, operating income was unfavorably impacted by fluctuations in foreign currency exchange rates by 10 percent.
In spite of the unfavorable currency impact, operating income in Latin America increased in 2012, reflecting solid volume growth
and favorable pricing across the group, partially offset by continued investments in the business, including some initial investments
related to the 2014 FIFA World CupTM.
North America’s operating income for the years ended December 31, 2012 and 2011 was $2,597 million and $2,319 million,
respectively. Operating income in 2012 was minimally impacted by fluctuations in foreign currency exchange rates and increased
primarily due to volume growth and favorable pricing. The effects of these favorable impacts on operating income were partially
offset by higher commodity costs and ongoing investment in marketplace executional capabilities. Additionally, operating income
in 2012 was reduced by $221 million due to charges related to the Company’s productivity and reinvestment program as well as
other restructuring initiatives, as compared to $358 million of restructuring charges related to the integration of CCE’s former
North America business in 2011.
Operating income in Pacific for the years ended December 31, 2012 and 2011 was $2,516 million and $2,239 million, respectively.
In 2012, operating income was favorably impacted by fluctuations in foreign currency exchange rates by 2 percent. Operating
income also benefited from operating leverage as a result of productivity initiatives, as well as positive geographic mix, partially
offset by shifts in product and channel mix.
Our Bottling Investments segment’s operating income for the years ended December 31, 2012 and 2011 was $140 million and
$224 million, respectively. Operating income in 2012 was unfavorably impacted by fluctuations in foreign currency exchange rates
by 19 percent. Operating income in 2012 was also reduced by $164 million due to charges related to the Company’s productivity
and reinvestment program as well as other restructuring initiatives, as compared to $89 million of similar charges in 2011.
The Corporate segment’s operating loss for the years ended December 31, 2012 and 2011 was $1,391 million and $1,517 million,
respectively. The 2012 loss was unfavorably impacted by fluctuations in foreign currency exchange rates by 1 percent. The 2012
operating loss was favorably impacted by charges of $33 million in 2012 related to the Company’s productivity and reinvestment
program as well as other restructuring initiatives, as compared to $122 million of similar charges in 2011.
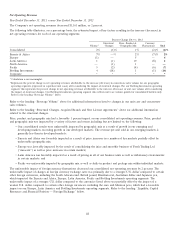
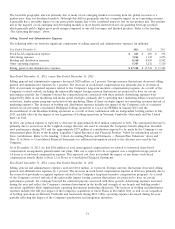
Interest Income
Year Ended December 31, 2013, versus Year Ended December 31, 2012
Interest income was $534 million in 2013, compared to $471 million in 2012, an increase of $63 million, or 13 percent. The
increase primarily reflects higher cash balances and an increased return on investments in certain of our international locations as
well as additional investments in debt securities and money market funds in connection with the Company’s overall cash
management strategy.
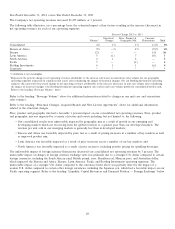
Year Ended December 31, 2012, versus Year Ended December 31, 2011
Interest income was $471 million in 2012, compared to $483 million in 2011, a decrease of $12 million, or 2 percent. The decrease
was primarily due to the impact of lower average interest rates, partially offset by higher average cash, cash equivalents and
short-term investment balances. The majority of the Company’s cash, cash equivalents and short-term investments is held by our
international locations.
56