Coca Cola 2013 Annual Report Download - page 73
Download and view the complete annual report
Please find page 73 of the 2013 Coca Cola annual report below. You can navigate through the pages in the report by either clicking on the pages listed below, or by using the keyword search tool below to find specific information within the annual report.-
 1
1 -
2
-
3
-
4
-
5
-
6
-
7
-
8
-
9
-
10
-
11
-
12
-
13
-
14
-
15
-
16
-
17
-
18
-
19
-
20
-
21
-
22
-
23
-
24
-
25
-
26
-
27
-
28
-
29
-
30
-
31
-
32
-
33
-
34
-
35
-
36
-
37
-
38
-
39
-
40
-
41
-
42
-
43
-
44
-
45
-
46
-
47
-
48
-
49
-
50
-
51
-
52
-
53
-
54
-
55
-
56
-
57
-
58
-
59
-
60
-
61
-
62
-
 63
63 -
 64
64 -
 65
65 -
 66
66 -
 67
67 -
 68
68 -
 69
69 -
 70
70 -
 71
71 -
 72
72 -
 73
73 -
 74
74 -
 75
75 -
 76
76 -
 77
77 -
 78
78 -
 79
79 -
 80
80 -
 81
81 -
 82
82 -
 83
83 -
84
-
85
-
86
-
87
-
88
-
89
-
90
-
91
-
92
-
93
-
94
-
95
-
96
-
97
-
98
-
99
-
100
-
101
-
102
-
103
-
104
-
105
-
106
-
107
-
108
-
109
-
110
-
111
-
112
-
113
-
114
-
115
-
116
-
117
-
118
-
119
-
120
-
121
-
122
-
123
-
124
-
125
-
126
-
127
-
128
-
129
-
130
-
131
-
132
-
133
-
134
-
135
-
136
-
137
-
138
-
139
-
140
-
141
-
142
-
143
-
144
-
145
-
146
-
147
-
148
-
149
-
150
-
151
-
152
-
153
-
154
-
155
-
156
-
157
-
158
-
159
-
160
 |
 |
Philippine and Brazilian bottling operations under the equity method of accounting. Refer to Note 2 of Notes to
Consolidated Financial Statements for additional information on these transactions.
• Other assets increased $1,076 million, or 30 percent, and other liabilities decreased $1,970 million, or 36 percent, primarily
due to the reclassification of certain pension plans’ net asset balances out of other liabilities as a result of actuarial gains,
higher returns and incremental funding during 2013. In addition, the other assets balance increased as a result of higher
investment balances in our captive insurance companies.
• Accounts payable and accrued expenses increased $897 million, or 10 percent, primarily due to the Company receiving
notification that put options it had issued in 2007 to minority shareholders of our German bottling and distribution
operations to sell their respective shares would be exercised in January 2014. As a result, the related liability was
reclassified out of the line item other liabilities into the line item accrued expenses in our consolidated balance sheet. Refer
to Note 2 of Notes to Consolidated Financial Statements for additional information on the bottling transaction. In addition,
accounts payable and accrued expenses increased due to the timing of marketing and restructuring accruals.
• Long-term debt increased $4,418 million, or 30 percent, primarily due to the Company’s issuance of long-term debt net of
early retirements during 2013. Refer to the heading ‘‘Cash Flows from Financing Activities’’ above and Note 10 of Notes to
Consolidated Financial Statements for additional information on our long-term debt balance.
• Deferred income taxes increased $1,171 million, or 24 percent, primarily due to the impact related to the net changes in
the Company’s U.S. pension plan assumptions as well as a deferred tax liability recorded as a result of the Company’s
equity investment in the newly combined Brazilian bottling operations. Refer to Note 2 of Notes to Consolidated Financial
Statements for additional information on the Brazilian bottling transaction and Note 13 of Notes to Consolidated Financial
Statements for additional information on the Company’s deferred income taxes.
ITEM 7A. QUANTITATIVE AND QUALITATIVE DISCLOSURES ABOUT MARKET RISK
Our Company uses derivative financial instruments primarily to reduce our exposure to adverse fluctuations in foreign currency
exchange rates, interest rates, commodity prices and other market risks. We do not enter into derivative financial instruments for
trading purposes. As a matter of policy, all of our derivative positions are used to reduce risk by hedging an underlying economic
exposure. Because of the high correlation between the hedging instrument and the underlying exposure, fluctuations in the value
of the instruments are generally offset by reciprocal changes in the value of the underlying exposure. The Company generally
hedges anticipated exposures up to 36 months in advance; however, the majority of our derivative instruments expire within
24 months or less. Virtually all of our derivatives are straightforward over-the-counter instruments with liquid markets.
We monitor our exposure to financial market risks using several objective measurement systems, including a sensitivity analysis to
measure our exposure to fluctuations in foreign currency exchange rates, interest rates and commodity prices. Refer to Note 5 of
Notes to Consolidated Financial Statements for additional information about our hedging transactions and derivative financial
instruments.
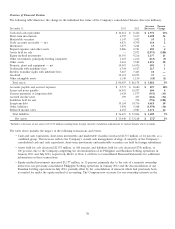
Foreign Currency Exchange Rates
We manage most of our foreign currency exposures on a consolidated basis, which allows us to net certain exposures and take
advantage of any natural offsets. In 2013, we used 81 functional currencies and generated $27,034 million of our net operating
revenues from operations outside the United States; therefore, weakness in one particular currency might be offset by strength in
other currencies over time. We use derivative financial instruments to further reduce our net exposure to foreign currency
fluctuations.
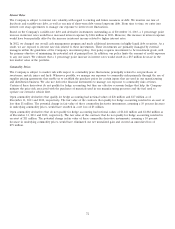
Our Company enters into forward exchange contracts and purchases currency options (principally euro and Japanese yen) and
collars to hedge certain portions of forecasted cash flows denominated in foreign currencies. Additionally, we enter into forward
exchange contracts to offset the earnings impact related to foreign currency fluctuations on certain monetary assets and liabilities.
We also enter into forward exchange contracts as hedges of net investments in international operations.
The total notional values of our foreign currency derivatives were $15,341 million and $11,148 million as of December 31, 2013
and 2012, respectively. This total includes derivative instruments that are designated and qualify for hedge accounting as well as
economic hedges. The fair value of the contracts that qualify for hedge accounting resulted in an asset of $196 million as of
December 31, 2013. At the end of 2013, we estimate that an unfavorable 10 percent change in the foreign currency exchange rates
would have eliminated the net unrealized gain and created an unrealized loss of $793 million. The fair value of the contracts that
do not qualify for hedge accounting resulted in an asset of $168 million, and we estimate that an unfavorable 10 percent change in
rates would have decreased our net gains by $325 million.
71