Coca Cola 2013 Annual Report Download - page 53
Download and view the complete annual report
Please find page 53 of the 2013 Coca Cola annual report below. You can navigate through the pages in the report by either clicking on the pages listed below, or by using the keyword search tool below to find specific information within the annual report.-
 1
1 -
2
-
3
-
4
-
5
-
6
-
7
-
8
-
9
-
10
-
11
-
12
-
13
-
14
-
15
-
16
-
17
-
18
-
19
-
20
-
21
-
22
-
23
-
24
-
25
-
26
-
27
-
28
-
29
-
30
-
31
-
32
-
33
-
34
-
35
-
36
-
37
-
38
-
39
-
40
-
41
-
42
-
 43
43 -
 44
44 -
 45
45 -
 46
46 -
 47
47 -
 48
48 -
 49
49 -
 50
50 -
 51
51 -
 52
52 -
 53
53 -
 54
54 -
 55
55 -
 56
56 -
 57
57 -
 58
58 -
 59
59 -
 60
60 -
 61
61 -
 62
62 -
 63
63 -
64
-
65
-
66
-
67
-
68
-
69
-
70
-
71
-
72
-
73
-
74
-
75
-
76
-
77
-
78
-
79
-
80
-
81
-
82
-
83
-
84
-
85
-
86
-
87
-
88
-
89
-
90
-
91
-
92
-
93
-
94
-
95
-
96
-
97
-
98
-
99
-
100
-
101
-
102
-
103
-
104
-
105
-
106
-
107
-
108
-
109
-
110
-
111
-
112
-
113
-
114
-
115
-
116
-
117
-
118
-
119
-
120
-
121
-
122
-
123
-
124
-
125
-
126
-
127
-
128
-
129
-
130
-
131
-
132
-
133
-
134
-
135
-
136
-
137
-
138
-
139
-
140
-
141
-
142
-
143
-
144
-
145
-
146
-
147
-
148
-
149
-
150
-
151
-
152
-
153
-
154
-
155
-
156
-
157
-
158
-
159
-
160
 |
 |

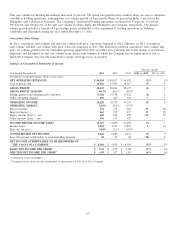
The favorable geographic mix was primarily due to many of our emerging markets recovering from the global recession at a
quicker pace than our developed markets. Although this shift in geographic mix has a negative impact on net operating revenues,
it generally has a favorable impact on our gross profit margin due to the correlated impact it has on our product mix. The product
mix in the majority of our emerging and developing markets is more heavily skewed toward our sparkling beverage products,
which generally yield a higher gross profit margin compared to our still beverages and finished products. Refer to the heading
‘‘Net Operating Revenues’’ above.
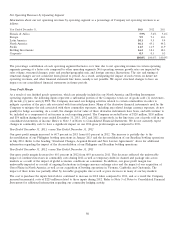
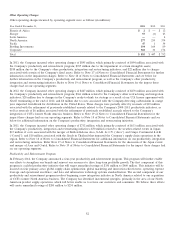
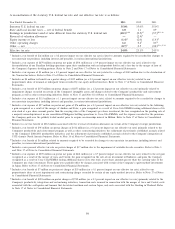
Selling, General and Administrative Expenses
The following table sets forth the significant components of selling, general and administrative expenses (in millions):
Year Ended December 31, 2013 2012 2011
Stock-based compensation expense $ 227 $ 259 $ 354
Advertising expenses 3,266 3,342 3,256
Bottling and distribution expenses 8,510 8,905 8,502
Other operating expenses 5,307 5,232 5,310
Selling, general and administrative expenses $ 17,310 $ 17,738 $ 17,422
Year Ended December 31, 2013, versus Year Ended December 31, 2012
Selling, general and administrative expenses decreased $428 million, or 2 percent. Foreign currency fluctuations decreased selling,
general and administrative expenses by 1 percent. The decrease in stock-based compensation was primarily due to reversals in
2013 of previously recognized expenses related to the Company’s long-term incentive compensation programs. As a result of the
Company’s revised outlook, including the unfavorable impact foreign currency fluctuations are projected to have on certain
performance periods, the Company lowered the estimated payouts associated with these periods. Advertising expenses were
impacted by shifts in our marketing and media spend strategies, primarily due to spending more marketing dollars toward in-store
activations, loyalty points programs and point-of-sale marketing. Many of these strategies impact net operating revenues instead of
marketing expenses. The decrease in bottling and distribution expenses includes the impact of the Company’s sale of a majority
interest in our previously consolidated Philippine bottling operations to Coca-Cola FEMSA in January 2013 and the
deconsolidation of our Brazilian bottling operations as a result of their combination with an independent bottling partner in July
2013, partially offset by the impact of our acquisition of bottling operations in Vietnam, Cambodia, Guatemala and the United
States in 2012.
In 2014, our pension expense is expected to decrease by approximately $165 million compared to 2013. The anticipated decrease is
primarily due to an increase in the weighted-average discount rate used to calculate the Company’s benefit obligation, favorable
asset performance during 2013 and the approximately $175 million of contributions expected to be made by the Company to our
international plans. Refer to the heading ‘‘Liquidity, Capital Resources and Financial Position’’ below for information related to
these contributions. Refer to the heading ‘‘Critical Accounting Policies and Estimates — Pension Plan Valuations’’ above and
Note 13 of Notes to Consolidated Financial Statements for additional information related to the discount rates used by the
Company.
As of December 31, 2013, we had $416 million of total unrecognized compensation cost related to nonvested share-based
compensation arrangements granted under our plans. This cost is expected to be recognized over a weighted-average period of
1.8 years as stock-based compensation expense. This expected cost does not include the impact of any future stock-based
compensation awards. Refer to Note 12 of Notes to Consolidated Financial Statements.
Year Ended December 31, 2012, versus Year Ended December 31, 2011
Selling, general and administrative expenses increased $316 million, or 2 percent. Foreign currency fluctuations decreased selling,
general and administrative expenses by 3 percent. The decrease in stock-based compensation expense in 2012 was primarily due to
the reversal of previously recognized expenses related to the Company’s long-term incentive compensation programs. As a result
of the Company’s revised outlook of the unfavorable impact foreign currency fluctuations are projected to have on certain
performance periods, the Company lowered the estimated payouts associated with these periods. Advertising expenses increased
during the year and reflect the Company’s continued investment in the health and strength of our brands and building market
execution capabilities while simultaneously capturing incremental marketing efficiencies. The increase in bottling and distribution
expenses includes the full year impact of the Company’s acquisition of Great Plains in December 2011 as well as our acquisition
of bottling operations in Vietnam, Cambodia and Guatemala during 2012. Other operating expenses decreased during the year,
partially reflecting the impact of the Company’s productivity and integration initiatives.
51