Coca Cola 2013 Annual Report Download - page 44
Download and view the complete annual report
Please find page 44 of the 2013 Coca Cola annual report below. You can navigate through the pages in the report by either clicking on the pages listed below, or by using the keyword search tool below to find specific information within the annual report.-
 1
1 -
2
-
3
-
4
-
5
-
6
-
7
-
8
-
9
-
10
-
11
-
12
-
13
-
14
-
15
-
16
-
17
-
18
-
19
-
20
-
21
-
22
-
23
-
24
-
25
-
26
-
27
-
28
-
29
-
30
-
31
-
32
-
33
-
 34
34 -
 35
35 -
 36
36 -
 37
37 -
 38
38 -
 39
39 -
 40
40 -
 41
41 -
 42
42 -
 43
43 -
 44
44 -
 45
45 -
 46
46 -
 47
47 -
 48
48 -
 49
49 -
 50
50 -
 51
51 -
 52
52 -
 53
53 -
 54
54 -
55
-
56
-
57
-
58
-
59
-
60
-
61
-
62
-
63
-
64
-
65
-
66
-
67
-
68
-
69
-
70
-
71
-
72
-
73
-
74
-
75
-
76
-
77
-
78
-
79
-
80
-
81
-
82
-
83
-
84
-
85
-
86
-
87
-
88
-
89
-
90
-
91
-
92
-
93
-
94
-
95
-
96
-
97
-
98
-
99
-
100
-
101
-
102
-
103
-
104
-
105
-
106
-
107
-
108
-
109
-
110
-
111
-
112
-
113
-
114
-
115
-
116
-
117
-
118
-
119
-
120
-
121
-
122
-
123
-
124
-
125
-
126
-
127
-
128
-
129
-
130
-
131
-
132
-
133
-
134
-
135
-
136
-
137
-
138
-
139
-
140
-
141
-
142
-
143
-
144
-
145
-
146
-
147
-
148
-
149
-
150
-
151
-
152
-
153
-
154
-
155
-
156
-
157
-
158
-
159
-
160
 |
 |
deferred tax assets and liabilities. Deferred tax assets and liabilities are determined based on temporary differences between the
financial reporting and tax bases of assets and liabilities. The tax rates used to determine deferred tax assets or liabilities are the
enacted tax rates in effect for the year and manner in which the differences are expected to reverse. Based on the evaluation of
all available information, the Company recognizes future tax benefits, such as net operating loss carryforwards, to the extent that
realizing these benefits is considered more likely than not.
We evaluate our ability to realize the tax benefits associated with deferred tax assets by analyzing our forecasted taxable income
using both historical and projected future operating results; the reversal of existing taxable temporary differences; taxable income
in prior carryback years (if permitted); and the availability of tax planning strategies. A valuation allowance is required to be
established unless management determines that it is more likely than not that the Company will ultimately realize the tax benefit
associated with a deferred tax asset. As of December 31, 2013, the Company’s valuation allowances on deferred tax assets were
$586 million and primarily related to uncertainties regarding the future realization of recorded tax benefits on tax loss
carryforwards generated in various jurisdictions. Current evidence does not suggest we will realize sufficient taxable income of the
appropriate character within the carryforward period to allow us to realize these deferred tax benefits. If we were to identify and
implement tax planning strategies to recover these deferred tax assets or generate sufficient income of the appropriate character
in these jurisdictions in the future, it could lead to the reversal of these valuation allowances and a reduction of income tax
expense. The Company believes it will generate sufficient future taxable income to realize the tax benefits related to the remaining
net deferred tax assets in our consolidated balance sheets.
The Company does not record a U.S. deferred tax liability for the excess of the book basis over the tax basis of its investments in
foreign corporations to the extent that the basis difference results from earnings that meet the indefinite reversal criteria. These
criteria are met if the foreign subsidiary has invested, or will invest, the undistributed earnings indefinitely. The decision as to the
amount of undistributed earnings that the Company intends to maintain in non-U.S. subsidiaries takes into account items
including, but not limited to, forecasts and budgets of financial needs of cash for working capital, liquidity plans, capital
improvement programs, merger and acquisition plans, and planned loans to other non-U.S. subsidiaries. The Company also
evaluates its expected cash requirements in the United States. Other factors that can influence that determination are local
restrictions on remittances (for example, in some countries a central bank application and approval are required in order for the
Company’s local country subsidiary to pay a dividend), economic stability and asset risk. As of December 31, 2013, undistributed
earnings of the Company’s foreign subsidiaries that met the indefinite reversal criteria amounted to $30.6 billion. Refer to Note 14
of Notes to Consolidated Financial Statements.
The Company’s effective tax rate is expected to be approximately 23 percent in 2014. This estimated tax rate does not reflect the
impact of any unusual or special items that may affect our tax rate in 2014.
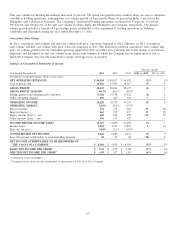
Operations Review
Our organizational structure as of December 31, 2013, consisted of the following operating segments, the first six of which are
sometimes referred to as ‘‘operating groups’’ or ‘‘groups’’: Eurasia and Africa; Europe; Latin America; North America; Pacific;
Bottling Investments; and Corporate. For further information regarding our operating segments, refer to Note 19 of Notes to
Consolidated Financial Statements.
Structural Changes, Acquired Brands and New License Agreements
In order to continually improve upon the Company’s operating performance, from time to time, we engage in buying and selling
ownership interests in bottling partners and other manufacturing operations. In addition, we also acquire brands or enter into
license agreements for certain brands to supplement our beverage offerings. These items impact our operating results and certain
key metrics used by management in assessing the Company’s performance.
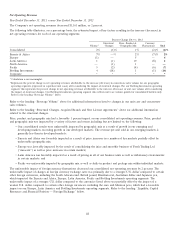
Unit case volume growth is a key metric used by management to evaluate the Company’s performance because it measures
demand for our products at the consumer level. The Company’s unit case volume represents the number of unit cases (or unit
case equivalents) of Company beverage products directly or indirectly sold by the Company and its bottling partners to customers
and, therefore, reflects unit case volume for consolidated and unconsolidated bottlers. Refer to the heading ‘‘Beverage Volume’’
below.
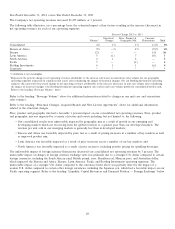
Concentrate sales volume represents the amount of concentrates and syrups (in all cases expressed in equivalent unit cases) sold
by, or used in finished products sold by, the Company to its bottling partners or other customers. Refer to the heading ‘‘Beverage
Volume’’ below.
Our Bottling Investments operating segment and our other finished product operations, including the finished product
operations in our North America operating segment, typically generate net operating revenues by selling sparkling beverages
and a variety of still beverages, such as juices and juice drinks, energy and sports drinks, ready-to-drink teas and coffees,
and certain water products, to retailers or to distributors, wholesalers and bottling partners who distribute them to retailers. In
42