Coca Cola 2013 Annual Report Download - page 115
Download and view the complete annual report
Please find page 115 of the 2013 Coca Cola annual report below. You can navigate through the pages in the report by either clicking on the pages listed below, or by using the keyword search tool below to find specific information within the annual report.-
 1
1 -
2
-
3
-
4
-
5
-
6
-
7
-
8
-
9
-
10
-
11
-
12
-
13
-
14
-
15
-
16
-
17
-
18
-
19
-
20
-
21
-
22
-
23
-
24
-
25
-
26
-
27
-
28
-
29
-
30
-
31
-
32
-
33
-
34
-
35
-
36
-
37
-
38
-
39
-
40
-
41
-
42
-
43
-
44
-
45
-
46
-
47
-
48
-
49
-
50
-
51
-
52
-
53
-
54
-
55
-
56
-
57
-
58
-
59
-
60
-
61
-
62
-
63
-
64
-
65
-
66
-
67
-
68
-
69
-
70
-
71
-
72
-
73
-
74
-
75
-
76
-
77
-
78
-
79
-
80
-
81
-
82
-
83
-
84
-
85
-
86
-
87
-
88
-
89
-
90
-
91
-
92
-
93
-
94
-
95
-
96
-
97
-
98
-
99
-
100
-
101
-
102
-
103
-
104
-
 105
105 -
 106
106 -
 107
107 -
 108
108 -
 109
109 -
 110
110 -
 111
111 -
 112
112 -
 113
113 -
 114
114 -
 115
115 -
 116
116 -
 117
117 -
 118
118 -
 119
119 -
 120
120 -
 121
121 -
 122
122 -
 123
123 -
 124
124 -
 125
125 -
126
-
127
-
128
-
129
-
130
-
131
-
132
-
133
-
134
-
135
-
136
-
137
-
138
-
139
-
140
-
141
-
142
-
143
-
144
-
145
-
146
-
147
-
148
-
149
-
150
-
151
-
152
-
153
-
154
-
155
-
156
-
157
-
158
-
159
-
160
 |
 |

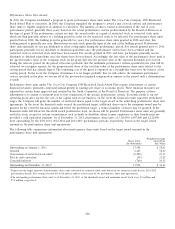
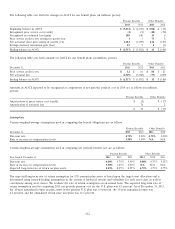
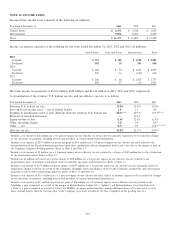
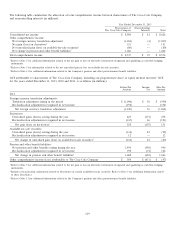
The assumed health care cost trend rates are as follows:
December 31, 2013 2012
Health care cost trend rate assumed for next year 8.00% 8.00%
Rate to which the cost trend rate is assumed to decline (the ultimate trend rate) 5.00% 5.00%
Year that the rate reaches the ultimate trend rate 2020 2019
The Company’s U.S. postretirement benefit plans are primarily defined dollar benefit plans that limit the effects of medical
inflation because the plans have established dollar limits for determining our contributions. As a result, the effect of a
1 percentage point change in the assumed health care cost trend rate would not be significant to the Company.
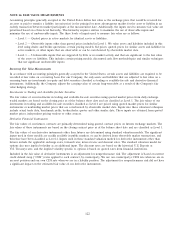
The discount rate assumptions used to account for pension and other postretirement benefit plans reflect the rates at which the
benefit obligations could be effectively settled. Rates for each of our U.S. plans at December 31, 2013, were determined using a
cash flow matching technique whereby the rates of a yield curve, developed from high-quality debt securities, were applied to the
benefit obligations to determine the appropriate discount rate. For our non-U.S. plans, we base the discount rate on comparable
indices within each of the countries. The rate of compensation increase assumption is determined by the Company based upon
annual reviews. We review external data and our own historical trends for health care costs to determine the health care cost
trend rate assumptions.
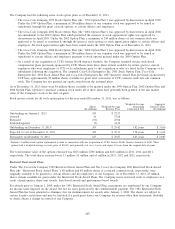
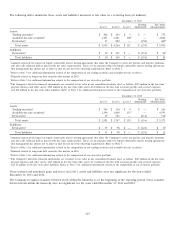
Cash Flows
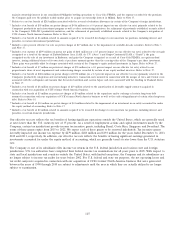
Our estimated future benefit payments for funded and unfunded plans are as follows (in millions):
Year Ended December 31, 2014 2015 2016 2017 2018 2019–2023
Pension benefit payments $ 471 $ 483 $ 512 $ 554 $ 558 $ 3,084
Other benefit payments159 62 64 65 66 346
Total estimated benefit payments $ 530 $ 545 $ 576 $ 619 $ 624 $ 3,430
1The expected benefit payments for our other postretirement benefit plans are net of estimated federal subsidies expected to be received under the
Medicare Prescription Drug, Improvement and Modernization Act of 2003. Federal subsidies are estimated to be approximately $8 million for the
period 2014–2018, and $5 million for the period 2019–2023.
The Company anticipates making pension contributions in 2014 of approximately $175 million, all of which will be allocated to our
international plans. The majority of these contributions are discretionary.
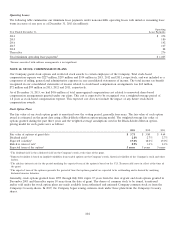
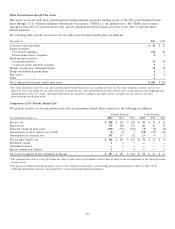
Defined Contribution Plans
Our Company sponsors qualified defined contribution plans covering substantially all U.S. employees. Under the largest U.S.
defined contribution plan, we match participants’ contributions up to a maximum of 3.5 percent of compensation, subject to
certain limitations. Company costs related to the U.S. plans were $97 million, $93 million and $78 million in 2013, 2012 and 2011,
respectively. We also sponsor defined contribution plans in certain locations outside the United States. Company costs associated
with those plans were $32 million, $29 million and $31 million in 2013, 2012 and 2011, respectively.
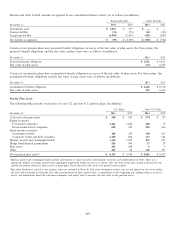
Multi-Employer Plans
As a result of our acquisition of CCE’s former North America business during the fourth quarter of 2010, the Company now
participates in various multi-employer pension plans in the United States. Multi-employer pension plans are designed to cover
employees from multiple employers and are typically established under collective bargaining agreements. These plans allow
multiple employers to pool their pension resources and realize efficiencies associated with the daily administration of the plan.
Multi-employer plans are generally governed by a board of trustees composed of management and labor representatives and are
funded through employer contributions.
The Company’s expense for U.S. multi-employer pension plans totaled $37 million, $31 million, and $69 million in 2013, 2012, and
2011, respectively. In 2011, the Company’s expense for U.S. multi-employer pension plans included charges of $32 million related
to the withdrawal from certain of these plans in connection with the Company’s integration initiatives in North America. Refer to
Note 18 for additional information related to these initiatives. The plans we currently participate in have contractual arrangements
that extend into 2018. If, in the future, we choose to withdraw from any of the multi-employer pension plans in which we
currently participate, we would need to record the appropriate withdrawal liabilities at that time.
113