Siemens 2013 Annual Report Download - page 114
Download and view the complete annual report
Please find page 114 of the 2013 Siemens annual report below. You can navigate through the pages in the report by either clicking on the pages listed below, or by using the keyword search tool below to find specific information within the annual report.-
 1
1 -
2
-
3
-
4
-
5
-
6
-
7
-
8
-
9
-
10
-
11
-
12
-
13
-
14
-
15
-
16
-
17
-
18
-
19
-
20
-
21
-
22
-
23
-
24
-
25
-
26
-
27
-
28
-
29
-
30
-
31
-
32
-
33
-
34
-
35
-
36
-
37
-
38
-
39
-
40
-
41
-
42
-
43
-
44
-
45
-
46
-
47
-
48
-
49
-
50
-
51
-
52
-
53
-
54
-
55
-
56
-
57
-
58
-
59
-
60
-
61
-
62
-
63
-
64
-
65
-
66
-
67
-
68
-
69
-
70
-
71
-
72
-
73
-
74
-
75
-
76
-
77
-
78
-
79
-
80
-
81
-
82
-
83
-
84
-
85
-
86
-
87
-
88
-
89
-
90
-
91
-
92
-
93
-
94
-
95
-
96
-
97
-
98
-
99
-
100
-
101
-
102
-
103
-
 104
104 -
 105
105 -
 106
106 -
 107
107 -
 108
108 -
 109
109 -
 110
110 -
 111
111 -
 112
112 -
 113
113 -
 114
114 -
 115
115 -
 116
116 -
 117
117 -
 118
118 -
 119
119 -
 120
120 -
 121
121 -
 122
122 -
 123
123 -
 124
124 -
125
-
126
-
127
-
128
-
129
-
130
-
131
-
132
-
133
-
134
-
135
-
136
-
137
-
138
-
139
-
140
-
141
-
142
-
143
-
144
-
145
-
146
-
147
-
148
-
149
-
150
-
151
-
152
-
153
-
154
-
155
-
156
-
157
-
158
-
159
-
160
-
161
-
162
-
163
-
164
-
165
-
166
-
167
-
168
-
169
-
170
-
171
-
172
-
173
-
174
-
175
-
176
-
177
-
178
-
179
-
180
-
181
-
182
-
183
-
184
-
185
-
186
-
187
-
188
-
189
-
190
-
191
-
192
-
193
-
194
-
195
-
196
-
197
-
198
-
199
-
200
-
201
-
202
-
203
-
204
-
205
-
206
-
207
-
208
-
209
-
210
-
211
-
212
-
213
-
214
-
215
-
216
-
217
-
218
-
219
-
220
-
221
-
222
-
223
-
224
-
225
-
226
-
227
-
228
-
229
-
230
-
231
-
232
-
233
-
234
-
235
-
236
-
237
-
238
-
239
-
240
-
241
-
242
-
243
-
244
-
245
-
246
-
247
-
248
-
249
-
250
-
251
-
252
-
253
-
254
-
255
-
256
-
257
-
258
-
259
-
260
-
261
-
262
-
263
-
264
-
265
-
266
-
267
-
268
-
269
-
270
-
271
-
272
-
273
-
274
-
275
-
276
-
277
-
278
-
279
-
280
-
281
-
282
-
283
-
284
-
285
-
286
-
287
-
288
-
289
-
290
-
291
-
292
-
293
-
294
-
295
-
296
-
297
-
298
-
299
-
300
-
301
-
302
-
303
-
304
-
305
-
306
-
307
-
308
-
309
-
310
-
311
-
312
-
313
-
314
-
315
-
316
-
317
-
318
-
319
-
320
-
321
-
322
-
323
-
324
-
325
-
326
-
327
-
328
-
329
-
330
-
331
-
332
-
333
-
334
-
335
-
336
-
337
-
338
-
339
-
340
-
341
-
342
-
343
-
344
-
345
-
346
-
347
-
348
-
349
-
350
-
351
-
352
-
353
-
354
-
355
-
356
-
357
-
358
-
359
-
360
-
361
-
362
-
363
-
364
-
365
-
366
-
367
-
368
-
369
-
370
-
371
-
372
 |
 |

92 A. To our Shareholders 117 B. Corporate Governance 155 C. Combined Management Report
92 A. Letter to our Shareholders
98 A. Managing Board of Siemens AG
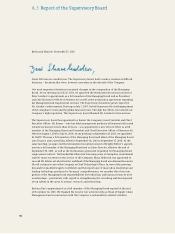
102 A.3 Report of the Supervisory Board
111 A.4 The Siemens Share / Investor Relations
A.4. Development of the Siemens share
Over the first two months of fiscal , the markets were
volatile. Then, at the beginning of December , share prices
started to rise steadily. Following some fluctuations and a set-
back on the German stock market, in particular, in February
, share prices reached an interim high at the end of May
. They subsequently declined again until the beginning of
July , when a strong upturn began, resulting in new highs
for the year at the end of fiscal .
Long-term performance of Siemens shares compared
with leading indices (average annual performance with dividends
and the corresponding value of the OSRAM spinoff reinvested)
Ten-year period FY 2004 – FY
Siemens 8.7%
DAX® 10.2%
MSCI World 7.6%
Over the entire fiscal year, Siemens stock performed relatively
well in the market environment, closing at €. per share on
September , . For shareholders who reinvested their div-
idends and their proceeds from the OSRAM spinoff, this
amounted to a gain of .% (fiscal : a gain of .%) com-
pared to the price on September , . The Siemens share
outperformed the leading index of the German stock market,
the DAX (which rose .%), and the leading international index,
MSCI World (which advanced .%).
A long-term comparison also illustrates the strength of the
Siemens share: the assets of an investor who acquired Siemens
stock worth €, at the beginning of fiscal and rein-
vested the dividends and the corresponding value of the
OSRAM spinoff in additional Siemens shares would have in-
creased to €, by the end of fiscal . This annual return
of .% is above the results for MSCI World (.%) but below
those for the DAX (.%).
A.. Dividend proposal
At the Annual Shareholders’ Meeting, the Managing Board and
the Supervisory Board will propose an unchanged dividend
payment of €., which represents a payout ratio of %. This
proposal continues without change our tradition of paying at-
tractive dividends to our investors.
A.. Share buyback program
In August , against the backdrop of favorable capital mar-
ket conditions, Siemens began to improve its capital structure
and repurchase treasury shares with a total value correspond-
ing to up to € billion. This program was concluded in Novem-
ber with a repurchase volume of about €. billion.
Siemens subsequently repurchased further shares in order to
keep the number of Siemens’ shares outstanding constant
until the spinoff of OSRAM Licht AG. The Company acquired a
total of about . million shares at an average price of €.,
for a total value corresponding to roughly €. billion. Of this
amount, some €. billion was attributable to fiscal .
Dividend
Fiscal year FY FY FY FY FY
Dividend per share in € 3.0013.00 3.00 2.70 1.60
Dividend yield in % 3.4 3.9 3.9 2.9 2.4
Ex-dividend date Jan. 29, 2014 Jan. 24, 2013 Jan. 25, 2012 Jan. 26, 2011 Jan. 27, 2010
Net income in millions of € 4,409 4,282 5,899 3,881 2,448
Total dividend payout in millions of € 2,53432,528 2,629 2,356 1,388
Payout ratio in % 57 56 41 58 56
1 To be proposed to the Annual Shareholders’ Meeting.
2 Dividend payout / Siemens share price on day of
Annual Shareholders’ Meeting; for fiscal :
dividend payout / Siemens share price at fiscal year-end.
3 Based on currently estimated number of shares entitled
to dividend payment.
4 Excluding non-cash items in fiscal and fiscal
(NSN and DX impairment charges), the payout
ratio equaled % in fiscal and % in fiscal .