Siemens 2013 Annual Report Download - page 184
Download and view the complete annual report
Please find page 184 of the 2013 Siemens annual report below. You can navigate through the pages in the report by either clicking on the pages listed below, or by using the keyword search tool below to find specific information within the annual report.-
 1
1 -
2
-
3
-
4
-
5
-
6
-
7
-
8
-
9
-
10
-
11
-
12
-
13
-
14
-
15
-
16
-
17
-
18
-
19
-
20
-
21
-
22
-
23
-
24
-
25
-
26
-
27
-
28
-
29
-
30
-
31
-
32
-
33
-
34
-
35
-
36
-
37
-
38
-
39
-
40
-
41
-
42
-
43
-
44
-
45
-
46
-
47
-
48
-
49
-
50
-
51
-
52
-
53
-
54
-
55
-
56
-
57
-
58
-
59
-
60
-
61
-
62
-
63
-
64
-
65
-
66
-
67
-
68
-
69
-
70
-
71
-
72
-
73
-
74
-
75
-
76
-
77
-
78
-
79
-
80
-
81
-
82
-
83
-
84
-
85
-
86
-
87
-
88
-
89
-
90
-
91
-
92
-
93
-
94
-
95
-
96
-
97
-
98
-
99
-
100
-
101
-
102
-
103
-
104
-
105
-
106
-
107
-
108
-
109
-
110
-
111
-
112
-
113
-
114
-
115
-
116
-
117
-
118
-
119
-
120
-
121
-
122
-
123
-
124
-
125
-
126
-
127
-
128
-
129
-
130
-
131
-
132
-
133
-
134
-
135
-
136
-
137
-
138
-
139
-
140
-
141
-
142
-
143
-
144
-
145
-
146
-
147
-
148
-
149
-
150
-
151
-
152
-
153
-
154
-
155
-
156
-
157
-
158
-
159
-
160
-
161
-
162
-
163
-
164
-
165
-
166
-
167
-
168
-
169
-
170
-
171
-
172
-
173
-
 174
174 -
 175
175 -
 176
176 -
 177
177 -
 178
178 -
 179
179 -
 180
180 -
 181
181 -
 182
182 -
 183
183 -
 184
184 -
 185
185 -
 186
186 -
 187
187 -
 188
188 -
 189
189 -
 190
190 -
 191
191 -
 192
192 -
 193
193 -
 194
194 -
195
-
196
-
197
-
198
-
199
-
200
-
201
-
202
-
203
-
204
-
205
-
206
-
207
-
208
-
209
-
210
-
211
-
212
-
213
-
214
-
215
-
216
-
217
-
218
-
219
-
220
-
221
-
222
-
223
-
224
-
225
-
226
-
227
-
228
-
229
-
230
-
231
-
232
-
233
-
234
-
235
-
236
-
237
-
238
-
239
-
240
-
241
-
242
-
243
-
244
-
245
-
246
-
247
-
248
-
249
-
250
-
251
-
252
-
253
-
254
-
255
-
256
-
257
-
258
-
259
-
260
-
261
-
262
-
263
-
264
-
265
-
266
-
267
-
268
-
269
-
270
-
271
-
272
-
273
-
274
-
275
-
276
-
277
-
278
-
279
-
280
-
281
-
282
-
283
-
284
-
285
-
286
-
287
-
288
-
289
-
290
-
291
-
292
-
293
-
294
-
295
-
296
-
297
-
298
-
299
-
300
-
301
-
302
-
303
-
304
-
305
-
306
-
307
-
308
-
309
-
310
-
311
-
312
-
313
-
314
-
315
-
316
-
317
-
318
-
319
-
320
-
321
-
322
-
323
-
324
-
325
-
326
-
327
-
328
-
329
-
330
-
331
-
332
-
333
-
334
-
335
-
336
-
337
-
338
-
339
-
340
-
341
-
342
-
343
-
344
-
345
-
346
-
347
-
348
-
349
-
350
-
351
-
352
-
353
-
354
-
355
-
356
-
357
-
358
-
359
-
360
-
361
-
362
-
363
-
364
-
365
-
366
-
367
-
368
-
369
-
370
-
371
-
372
 |
 |

92 A. To our Shareholders
117 B. Corporate Governance 155 C. Combined Management Report
156 C. Business and economic environment
173 C. Financial performance system
179 C. Results of operations
192 C. Financial position
204 C. Net assets position
207 C. Overall assessment of the economic position
209 C. Subsequent events
210 C. Sustainability
227 C. Report on expected developments and
associated material opportunities and risks
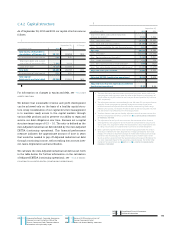
Revenue by Business
Year ended September , % Change therein
(in millions of €) Actual Adjusted Currency Portfolio
Fossil Power Generation 10,239 11,161 (8)% (7)% (1)% 0%
Wind Power 5,174 5,066 2% 4% (2)% 1%
Oil & Gas 5,152 5,115 1% 0% (1)% 2%
Power Transmission 6,167 6,593 (6)% (4)% (2)% 0%
1 Excluding currency translation and portfolio effects.
Profit and Profit margin by Business
Profit Profit margin
Year ended September , Year ended September ,
(in millions of €) % Change
Fossil Power Generation 1,693 1,933 (12)% 16.5% 17.3%
Wind Power 306 304 1% 5.9% 6.0%
Oil & Gas 433 218 99% 8.4% 4.3%
Power Transmission (156) (302) 48% (2.5)% (4.6)%
Fossil Power Generation generated profit of €. billion in
fiscal , significantly below €. billion in fiscal . The
main drivers of the change were a decline in revenue in the
solutions business and a less favorable revenue mix particular-
ly in the products business. Both years included burdens on
profit. In the current year, the Division recorded € million in
“Siemens ” charges. A year earlier, charges of € million
related to the Olkiluoto project in Finland were partly offset by
an € million gain on the Division’s divestment of its joint
venture stake in OAO Power Machines. Revenue was % lower
year-over-year, resulting mainly from declining order intake for
turnkey projects. On a geographic basis, revenue declined sig-
nificantly in the Europe, C.I.S., Africa, Middle East region. Order
intake was down %, as a substantial decrease in Asia, Austra-
lia and a moderate decline in the region Europe, C.I.S., Africa,
Middle East were partially offset by a significant increase in
the Americas.
Profit at Wind Power was € million in fiscal , nearly
unchanged from fiscal . Both fiscal years included burdens
on profit. In the current fiscal year, the Division took the €
million in charges mentioned above, for inspecting and retro-
fitting installed onshore turbine blades, primarily in the U.S.
A year earlier, profit was held back by a € million provision
related to a wind turbine component from an external supplier
and a charge of € million related to capacity adjustment.
Revenue was slightly higher than in the prior year as increases
in Europe, C.I.S., Africa, Middle East and Asia, Australia more
than compensated for a sharp decline in the Americas. The
sharp decline in the Americas was due to the onshore wind
farm business, where the U.S is the largest national market for
Wind Power. New projects in the U.S. were halted or postponed
in the latter half of due to uncertainty regarding continu-
ation of production tax incentives. The resulting order gap led
to a steep drop in fiscal revenue in the Americas com-
pared to a year earlier. Order intake was up % year-over-year,
due mainly to a much higher volume from large orders, which
included several large offshore wind-farms in Europe, C.I.S.,
Africa, Middle East.
Profit at Oil & Gas almost doubled year-over-year, to € mil-
lion, due primarily to substantially lower charges related to ad-
justments for long-term construction and service contracts
with customers in Iran. In fiscal , the Division recorded
€ million in these charges on Division profit in the first quar-
ter as part of compliance with sanctions on Iran, primarily on
its oil and gas industries, enacted in October . In fiscal
, the Division recorded charges totaling € million relat-
ed to Iran, mainly as a result of a revenue reduction of €
million. The Division also took € million in charges for the
“Siemens ” program. Revenue was slightly higher com-
pared to the prior year on increases in Europe, C.I.S., Africa,
Middle East and the Americas, partially offset by a decrease in
Asia, Australia. Order intake was up % as growth in Asia, Aus-
tralia and Europe, C.I.S., Africa, Middle East more than offset a
decline in the Americas.