Siemens 2013 Annual Report Download - page 189
Download and view the complete annual report
Please find page 189 of the 2013 Siemens annual report below. You can navigate through the pages in the report by either clicking on the pages listed below, or by using the keyword search tool below to find specific information within the annual report.-
 1
1 -
2
-
3
-
4
-
5
-
6
-
7
-
8
-
9
-
10
-
11
-
12
-
13
-
14
-
15
-
16
-
17
-
18
-
19
-
20
-
21
-
22
-
23
-
24
-
25
-
26
-
27
-
28
-
29
-
30
-
31
-
32
-
33
-
34
-
35
-
36
-
37
-
38
-
39
-
40
-
41
-
42
-
43
-
44
-
45
-
46
-
47
-
48
-
49
-
50
-
51
-
52
-
53
-
54
-
55
-
56
-
57
-
58
-
59
-
60
-
61
-
62
-
63
-
64
-
65
-
66
-
67
-
68
-
69
-
70
-
71
-
72
-
73
-
74
-
75
-
76
-
77
-
78
-
79
-
80
-
81
-
82
-
83
-
84
-
85
-
86
-
87
-
88
-
89
-
90
-
91
-
92
-
93
-
94
-
95
-
96
-
97
-
98
-
99
-
100
-
101
-
102
-
103
-
104
-
105
-
106
-
107
-
108
-
109
-
110
-
111
-
112
-
113
-
114
-
115
-
116
-
117
-
118
-
119
-
120
-
121
-
122
-
123
-
124
-
125
-
126
-
127
-
128
-
129
-
130
-
131
-
132
-
133
-
134
-
135
-
136
-
137
-
138
-
139
-
140
-
141
-
142
-
143
-
144
-
145
-
146
-
147
-
148
-
149
-
150
-
151
-
152
-
153
-
154
-
155
-
156
-
157
-
158
-
159
-
160
-
161
-
162
-
163
-
164
-
165
-
166
-
167
-
168
-
169
-
170
-
171
-
172
-
173
-
174
-
175
-
176
-
177
-
178
-
 179
179 -
 180
180 -
 181
181 -
 182
182 -
 183
183 -
 184
184 -
 185
185 -
 186
186 -
 187
187 -
 188
188 -
 189
189 -
 190
190 -
 191
191 -
 192
192 -
 193
193 -
 194
194 -
 195
195 -
 196
196 -
 197
197 -
 198
198 -
 199
199 -
200
-
201
-
202
-
203
-
204
-
205
-
206
-
207
-
208
-
209
-
210
-
211
-
212
-
213
-
214
-
215
-
216
-
217
-
218
-
219
-
220
-
221
-
222
-
223
-
224
-
225
-
226
-
227
-
228
-
229
-
230
-
231
-
232
-
233
-
234
-
235
-
236
-
237
-
238
-
239
-
240
-
241
-
242
-
243
-
244
-
245
-
246
-
247
-
248
-
249
-
250
-
251
-
252
-
253
-
254
-
255
-
256
-
257
-
258
-
259
-
260
-
261
-
262
-
263
-
264
-
265
-
266
-
267
-
268
-
269
-
270
-
271
-
272
-
273
-
274
-
275
-
276
-
277
-
278
-
279
-
280
-
281
-
282
-
283
-
284
-
285
-
286
-
287
-
288
-
289
-
290
-
291
-
292
-
293
-
294
-
295
-
296
-
297
-
298
-
299
-
300
-
301
-
302
-
303
-
304
-
305
-
306
-
307
-
308
-
309
-
310
-
311
-
312
-
313
-
314
-
315
-
316
-
317
-
318
-
319
-
320
-
321
-
322
-
323
-
324
-
325
-
326
-
327
-
328
-
329
-
330
-
331
-
332
-
333
-
334
-
335
-
336
-
337
-
338
-
339
-
340
-
341
-
342
-
343
-
344
-
345
-
346
-
347
-
348
-
349
-
350
-
351
-
352
-
353
-
354
-
355
-
356
-
357
-
358
-
359
-
360
-
361
-
362
-
363
-
364
-
365
-
366
-
367
-
368
-
369
-
370
-
371
-
372
 |
 |

253 D. Consolidated Financial Statements
357 E. Additional Information
245 C. Compensation Report, Corporate Governance
statement pursuant to Section a of the
German Commercial Code, Takeover-relevant
information and explanatory report
246 C. Siemens AG ( Discussion on basis of
German Commercial Code)
250 C. Notes and forward-looking statements
Profit at Power Grid Solutions & Products came in at € mil-
lion, down from € million a year earlier. The decline was
due to € million in “Siemens ” charges. Revenue and or-
ders increased slightly year-over-year. On a regional basis, rev-
enue was higher in Asia, Australia and the Americas and de-
clined slightly in Europe, C.I.S., Africa, Middle East. Orders rose
in Asia, Australia and Europe, C.I.S., Africa, Middle East, only
partly offset by a decline in the Americas.
Profit at Building Technology declined to € million in fiscal
, from € million a year earlier as the Division absorbed
€ million in “Siemens ” charges in the current period.
Selective order intake led to a more favorable business mix
compared to the prior fiscal year, particularly including Build-
ing Technologies’ higher-margin product and service business.
It also led to a slight decline in revenue and orders year-over-
year. On a regional basis, lower volume was due mainly to the
Americas.
C... EQUITY INVESTMENTS
In fiscal , Equity Investments recorded a profit of €
million, compared to a loss of € million a year earlier. This
improvement year-over-year was due mainly to a sharply lower
loss related to our share in NSN, which declined to € million
from € million a year earlier. In addition, results related to
NSN in fiscal benefited from a positive effect of € mil-
lion stemming from a partial reversal of a fiscal impair-
ment of our stake in NSN, and a gain of € million from the
sale of the NSN stake in the fourth quarter of fiscal . The
equity investment loss related to our share in EN widened to
€ million in fiscal from a loss of € million a year earli-
er. The loss in the current period was due largely to additions
to Siemens’ net investment in EN, which resulted in the recog-
nition of previously unrecognized losses. Profit at Equity Invest-
ments
in both fiscal years included equity investment income
related to our stake in BSH.
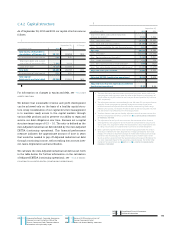
C... FINANCIAL SERVICES (SFS)
(in millions of €)
Year ended September , % Change
Income before income taxes 409 479 (14)%
Total assets 18,661 17,405 7%
Profit (defined as income before income taxes) at SFS came in
at € million, compared to € million in the prior-year
period, which benefited from a € million gain on the sale of
a
portion of SFS’s stake in Bangalore International Airport Limit-
ed
. SFS continued to successfully execute its growth strategy
and higher total assets year-over-year helped generate a higher
interest result compared to the prior-year. The current period
was affected by burdens including a € million impairment of
SFS’s equity stake in a power plant project in the U.S.
C... RECONCILIATION TO
CONSOLIDATED FINANCIAL STATEMENTS
Reconciliation to Consolidated Financial Statements includes
Centrally managed portfolio activities, Siemens Real Estate
(SRE) and various categories of items which are not allocated
to the Sectors and to SFS because the Company ’s management
has determined that such items are not indicative of the Sectors’
and SFS’ respective performance.
Centrally managed portfolio activities
Centrally managed portfolio activities reported a loss of €
million in fiscal , compared to a loss of € million in fiscal
.
Siemens Real Estate (SRE)
Income before income taxes at SRE was € million in fiscal
, compared to € million in fiscal . This increase
was due in part to higher income related to the disposal of real
estate.
Corporate items and pensions
Corporate items and pensions reported a loss of € million
in fiscal compared to a loss of € million in fiscal .
The loss at Corporate items was € million, compared to a
loss of € million in fiscal which included positive
effects related to legal and regulatory matters. Centrally carried
pension expense totaled € million in fiscal , compared
to € million in fiscal .
Eliminations, Corporate Treasury
and other reconciling items
Income before income taxes from Eliminations, Corporate
Treasury and other reconciling items was a negative € mil-
lion in fiscal , compared to a positive € million in the
same period a year earlier. The change year-over-year included
lower results from Corporate Treasury activities, due mainly to
lower interest income from liquidity compared to the prior-year
period.