Siemens 2013 Annual Report Download - page 185
Download and view the complete annual report
Please find page 185 of the 2013 Siemens annual report below. You can navigate through the pages in the report by either clicking on the pages listed below, or by using the keyword search tool below to find specific information within the annual report.-
 1
1 -
2
-
3
-
4
-
5
-
6
-
7
-
8
-
9
-
10
-
11
-
12
-
13
-
14
-
15
-
16
-
17
-
18
-
19
-
20
-
21
-
22
-
23
-
24
-
25
-
26
-
27
-
28
-
29
-
30
-
31
-
32
-
33
-
34
-
35
-
36
-
37
-
38
-
39
-
40
-
41
-
42
-
43
-
44
-
45
-
46
-
47
-
48
-
49
-
50
-
51
-
52
-
53
-
54
-
55
-
56
-
57
-
58
-
59
-
60
-
61
-
62
-
63
-
64
-
65
-
66
-
67
-
68
-
69
-
70
-
71
-
72
-
73
-
74
-
75
-
76
-
77
-
78
-
79
-
80
-
81
-
82
-
83
-
84
-
85
-
86
-
87
-
88
-
89
-
90
-
91
-
92
-
93
-
94
-
95
-
96
-
97
-
98
-
99
-
100
-
101
-
102
-
103
-
104
-
105
-
106
-
107
-
108
-
109
-
110
-
111
-
112
-
113
-
114
-
115
-
116
-
117
-
118
-
119
-
120
-
121
-
122
-
123
-
124
-
125
-
126
-
127
-
128
-
129
-
130
-
131
-
132
-
133
-
134
-
135
-
136
-
137
-
138
-
139
-
140
-
141
-
142
-
143
-
144
-
145
-
146
-
147
-
148
-
149
-
150
-
151
-
152
-
153
-
154
-
155
-
156
-
157
-
158
-
159
-
160
-
161
-
162
-
163
-
164
-
165
-
166
-
167
-
168
-
169
-
170
-
171
-
172
-
173
-
174
-
 175
175 -
 176
176 -
 177
177 -
 178
178 -
 179
179 -
 180
180 -
 181
181 -
 182
182 -
 183
183 -
 184
184 -
 185
185 -
 186
186 -
 187
187 -
 188
188 -
 189
189 -
 190
190 -
 191
191 -
 192
192 -
 193
193 -
 194
194 -
 195
195 -
196
-
197
-
198
-
199
-
200
-
201
-
202
-
203
-
204
-
205
-
206
-
207
-
208
-
209
-
210
-
211
-
212
-
213
-
214
-
215
-
216
-
217
-
218
-
219
-
220
-
221
-
222
-
223
-
224
-
225
-
226
-
227
-
228
-
229
-
230
-
231
-
232
-
233
-
234
-
235
-
236
-
237
-
238
-
239
-
240
-
241
-
242
-
243
-
244
-
245
-
246
-
247
-
248
-
249
-
250
-
251
-
252
-
253
-
254
-
255
-
256
-
257
-
258
-
259
-
260
-
261
-
262
-
263
-
264
-
265
-
266
-
267
-
268
-
269
-
270
-
271
-
272
-
273
-
274
-
275
-
276
-
277
-
278
-
279
-
280
-
281
-
282
-
283
-
284
-
285
-
286
-
287
-
288
-
289
-
290
-
291
-
292
-
293
-
294
-
295
-
296
-
297
-
298
-
299
-
300
-
301
-
302
-
303
-
304
-
305
-
306
-
307
-
308
-
309
-
310
-
311
-
312
-
313
-
314
-
315
-
316
-
317
-
318
-
319
-
320
-
321
-
322
-
323
-
324
-
325
-
326
-
327
-
328
-
329
-
330
-
331
-
332
-
333
-
334
-
335
-
336
-
337
-
338
-
339
-
340
-
341
-
342
-
343
-
344
-
345
-
346
-
347
-
348
-
349
-
350
-
351
-
352
-
353
-
354
-
355
-
356
-
357
-
358
-
359
-
360
-
361
-
362
-
363
-
364
-
365
-
366
-
367
-
368
-
369
-
370
-
371
-
372
 |
 |

253 D. Consolidated Financial Statements
357 E. Additional Information
245 C. Compensation Report, Corporate Governance
statement pursuant to Section a of the
German Commercial Code, Takeover-relevant
information and explanatory report
246 C. Siemens AG ( Discussion on basis of
German Commercial Code)
250 C. Notes and forward-looking statements
Power Transmission sharply reduced its loss compared to fis-
cal , to € million, despite € million in charges for
the “Siemens ” program. The major factor in the change
was lower project charges related mainly to grid connections
to offshore wind-farms, which fell to € million from €
million a year earlier. These charges were due to project de-
lays resulting from regulatory complexity and the projects’
challenging marine environment, which required revised esti-
mates of resources and personnel. Profit development was
held back by margin compression related to these projects
and orders booked in prior periods with significant pricing
pressure. Operational challenges strongly cut back profit in
the high-voltage products business. Revenue for the Division
was down % year-over-year due to declines in Europe, C.I.S.,
Africa, Middle East and Asia, Australia. Orders came in % low-
er compared to the prior year, due in part to more selective
order intake. On a regional basis, a decline in Europe, C.I.S.,
Africa, Middle East was partially offset by increases in other
regions. The Division expects continuing challenges in com-
ing quarters.
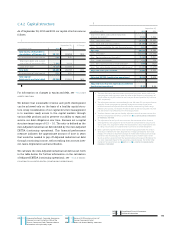
C... HEALTHCARE
Sector
Year ended September , % Change therein
(in millions of €) Actual Adjusted Currency Portfolio
Profit 2,048 1,815 13%
Profit margin 15.0% 13.3%
Orders 13,950 13,806 1% 4% (3)% 0%
Total revenue 13,621 13,642 0% 2% (3)% 0%
External revenue 13,598 13,600 0%
therein:
Europe, C.I.S., Africa, Middle East 4,544 4,593 (1)%
therein Germany 995 1,056 (6)%
Americas 5,631 5,692 (1)%
Asia, Australia 3,422 3,315 3%
1 Excluding currency translation and portfolio effects. 2 Commonwealth of Independent States.
The Healthcare Sector delivered €. billion in profit in fis-
cal , up significantly from the prior-year level with all busi-
nesses contributing to profit growth. Results for the year were
positively influenced by lower charges associated with the Sec-
tor’s “Agenda ” initiative, which declined to € million
from € million in fiscal . Healthcare intends to main-
tain the achievements of the initiative going forward, includ-
ing improvements in cost position and competitiveness. In
particular, expenses for research and development and selling
and general administrative expenses both declined compared
to fiscal . Effective January , , results for Healthcare
included negative effects on profit from an excise tax on medi-
cal devices which was introduced in the U.S., affecting most
businesses in the Sector.
Profit at Diagnostics came in at € million compared to €
million a year earlier. Profit development followed the pattern
of the Sector with regard to “Agenda ,” including lower
charges and improvements in cost position. In particular the
charges fell to € million from € million in fiscal . Pur-
chase price allocation (PPA) effects related to past acquisitions
at Diagnostics were € million in fiscal . A year earlier,
Diagnostics recorded € million in PPA effects.
Revenue for Healthcare in fiscal was nearly unchanged
compared to fiscal , while orders increased slightly year-
over-year. On an organic basis, both revenue and orders were
up. On a geographic basis, revenue growth in Asia, Australia
was offset by declines in the other regions. Asia, Australia and
the Americas drove order growth due to increases in China and
the U.S. The book-to-bill ratio was ., and Healthcare’s order
backlog was € billion at the end of fiscal .
Revenue at Diagnostics declined % in fiscal , from €.
billion to €. billion, and showed the same development
as the Sector with regard to the regions. On comparable basis
revenue was up %.