Siemens 2013 Annual Report Download - page 188
Download and view the complete annual report
Please find page 188 of the 2013 Siemens annual report below. You can navigate through the pages in the report by either clicking on the pages listed below, or by using the keyword search tool below to find specific information within the annual report.-
 1
1 -
2
-
3
-
4
-
5
-
6
-
7
-
8
-
9
-
10
-
11
-
12
-
13
-
14
-
15
-
16
-
17
-
18
-
19
-
20
-
21
-
22
-
23
-
24
-
25
-
26
-
27
-
28
-
29
-
30
-
31
-
32
-
33
-
34
-
35
-
36
-
37
-
38
-
39
-
40
-
41
-
42
-
43
-
44
-
45
-
46
-
47
-
48
-
49
-
50
-
51
-
52
-
53
-
54
-
55
-
56
-
57
-
58
-
59
-
60
-
61
-
62
-
63
-
64
-
65
-
66
-
67
-
68
-
69
-
70
-
71
-
72
-
73
-
74
-
75
-
76
-
77
-
78
-
79
-
80
-
81
-
82
-
83
-
84
-
85
-
86
-
87
-
88
-
89
-
90
-
91
-
92
-
93
-
94
-
95
-
96
-
97
-
98
-
99
-
100
-
101
-
102
-
103
-
104
-
105
-
106
-
107
-
108
-
109
-
110
-
111
-
112
-
113
-
114
-
115
-
116
-
117
-
118
-
119
-
120
-
121
-
122
-
123
-
124
-
125
-
126
-
127
-
128
-
129
-
130
-
131
-
132
-
133
-
134
-
135
-
136
-
137
-
138
-
139
-
140
-
141
-
142
-
143
-
144
-
145
-
146
-
147
-
148
-
149
-
150
-
151
-
152
-
153
-
154
-
155
-
156
-
157
-
158
-
159
-
160
-
161
-
162
-
163
-
164
-
165
-
166
-
167
-
168
-
169
-
170
-
171
-
172
-
173
-
174
-
175
-
176
-
177
-
 178
178 -
 179
179 -
 180
180 -
 181
181 -
 182
182 -
 183
183 -
 184
184 -
 185
185 -
 186
186 -
 187
187 -
 188
188 -
 189
189 -
 190
190 -
 191
191 -
 192
192 -
 193
193 -
 194
194 -
 195
195 -
 196
196 -
 197
197 -
 198
198 -
199
-
200
-
201
-
202
-
203
-
204
-
205
-
206
-
207
-
208
-
209
-
210
-
211
-
212
-
213
-
214
-
215
-
216
-
217
-
218
-
219
-
220
-
221
-
222
-
223
-
224
-
225
-
226
-
227
-
228
-
229
-
230
-
231
-
232
-
233
-
234
-
235
-
236
-
237
-
238
-
239
-
240
-
241
-
242
-
243
-
244
-
245
-
246
-
247
-
248
-
249
-
250
-
251
-
252
-
253
-
254
-
255
-
256
-
257
-
258
-
259
-
260
-
261
-
262
-
263
-
264
-
265
-
266
-
267
-
268
-
269
-
270
-
271
-
272
-
273
-
274
-
275
-
276
-
277
-
278
-
279
-
280
-
281
-
282
-
283
-
284
-
285
-
286
-
287
-
288
-
289
-
290
-
291
-
292
-
293
-
294
-
295
-
296
-
297
-
298
-
299
-
300
-
301
-
302
-
303
-
304
-
305
-
306
-
307
-
308
-
309
-
310
-
311
-
312
-
313
-
314
-
315
-
316
-
317
-
318
-
319
-
320
-
321
-
322
-
323
-
324
-
325
-
326
-
327
-
328
-
329
-
330
-
331
-
332
-
333
-
334
-
335
-
336
-
337
-
338
-
339
-
340
-
341
-
342
-
343
-
344
-
345
-
346
-
347
-
348
-
349
-
350
-
351
-
352
-
353
-
354
-
355
-
356
-
357
-
358
-
359
-
360
-
361
-
362
-
363
-
364
-
365
-
366
-
367
-
368
-
369
-
370
-
371
-
372
 |
 |

92 A. To our Shareholders
117 B. Corporate Governance 155 C. Combined Management Report
156 C. Business and economic environment
173 C. Financial performance system
179 C. Results of operations
192 C. Financial position
204 C. Net assets position
207 C. Overall assessment of the economic position
209 C. Subsequent events
210 C. Sustainability
227 C. Report on expected developments and
associated material opportunities and risks
and integration costs related to its Invensys Rail acquisition,
which closed in the third quarter of fiscal , further im-
pacted the Business’ profit year-over-year. As a result of the
above mentioned factors, Transportation & Logistics posted a
loss in the current fiscal year, compared to a profit in the prior
fiscal year.
Revenue was up % compared to the prior fiscal year, as in-
creases at Transportation & Logistics and Power Grid Solu-
tions & Products more than offset a slight decline at Building
Technologies. Orders for the Sector rose substantially year-
over-year. This growth was driven by Transportation & Logis-
tics, which recorded a sharply higher volume from major or-
ders compared to the prior fiscal year including €. billion for
trains and maintenance in the U.K. Orders for Power Grid Solu-
tions & Products were also higher year-over-year, while orders
for Building Technologies came in near the prior-year level. On
a regional basis, revenue rose in Europe, C.I.S., Africa, Middle
East and in Asia, Australia. Regional order development was
similar but even more pronounced. The large contract awards
mentioned above drove growth in Europe, C.I.S., Africa, Middle
East. Orders in Asia, Australia were also up substantially. On a
book-to-bill ratio of ., Infrastructure & Cities’ order backlog
rose to € billion at the end of fiscal .
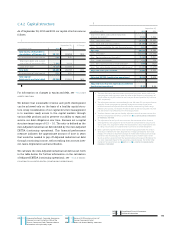
Orders by Business
Year ended September , % Change therein
(in millions of €) Actual Adjusted Currency Portfolio
Transportation & Logistics 10,040 5,382 87% 85% (5)% 6%
Power Grid Solutions & Products 6,392 6,275 2% 4% (2)% 0%
Building Technologies 5,769 5,809 (1)% 0% (1)% 0%
1 Excluding currency translation and portfolio effects.
Revenue by Business
Year ended September , % Change therein
(in millions of €) Actual Adjusted Currency Portfolio
Transportation & Logistics 6,318 5,969 6% 2% (2)% 6%
Power Grid Solutions & Products 6,102 6,068 1% 3% (2)% 0%
Building Technologies 5,754 5,820 (1)% 0% (1)% 0%
1 Excluding currency translation and portfolio effects.
Profit and Profit margin by Business
Profit Profit margin
Year ended September , Year ended September ,
(in millions of €) % Change
Transportation & Logistics (448) 236 n/a (7.1)% 4.0%
Power Grid Solutions & Products 403 457 (12)% 6.6% 7.5%
Building Technologies 351 379 (7)% 6.1% 6.5%
Transportation & Logistics posted a loss of € million in
the current fiscal year, compared to profit of € million a
year earlier. The two main factors for the change were sharply
higher project charges year-over-year, which included the
above mentioned € million from delays for receiving certifi-
cation for new high-speed trains in fiscal , up from €
million for these matters in the prior fiscal year, and € mil-
lion in charges related to “Siemens .” The latter charges
include a goodwill impairment of € million on the airport
logistics and postal automation business which Transporta-
tion & Logistics intends to sell. Profit development for the fiscal
year was also held back by low margins associated with large
long-term contracts. The acquisition of Invensys Rail during
the third quarter of fiscal resulted in € million in trans-
action and integration costs for the fiscal year and PPA effects
of € million. Revenue for the Business rose % while orders
were up %, due primarily to a sharply higher volume from
major orders year-over-year, including the above-mentioned
€. billion order in the U.K. Both revenue and order growth
benefited from the acquisition of Invensys Rail.