Siemens 2013 Annual Report Download - page 187
Download and view the complete annual report
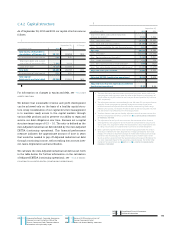
Please find page 187 of the 2013 Siemens annual report below. You can navigate through the pages in the report by either clicking on the pages listed below, or by using the keyword search tool below to find specific information within the annual report.-
 1
1 -
2
-
3
-
4
-
5
-
6
-
7
-
8
-
9
-
10
-
11
-
12
-
13
-
14
-
15
-
16
-
17
-
18
-
19
-
20
-
21
-
22
-
23
-
24
-
25
-
26
-
27
-
28
-
29
-
30
-
31
-
32
-
33
-
34
-
35
-
36
-
37
-
38
-
39
-
40
-
41
-
42
-
43
-
44
-
45
-
46
-
47
-
48
-
49
-
50
-
51
-
52
-
53
-
54
-
55
-
56
-
57
-
58
-
59
-
60
-
61
-
62
-
63
-
64
-
65
-
66
-
67
-
68
-
69
-
70
-
71
-
72
-
73
-
74
-
75
-
76
-
77
-
78
-
79
-
80
-
81
-
82
-
83
-
84
-
85
-
86
-
87
-
88
-
89
-
90
-
91
-
92
-
93
-
94
-
95
-
96
-
97
-
98
-
99
-
100
-
101
-
102
-
103
-
104
-
105
-
106
-
107
-
108
-
109
-
110
-
111
-
112
-
113
-
114
-
115
-
116
-
117
-
118
-
119
-
120
-
121
-
122
-
123
-
124
-
125
-
126
-
127
-
128
-
129
-
130
-
131
-
132
-
133
-
134
-
135
-
136
-
137
-
138
-
139
-
140
-
141
-
142
-
143
-
144
-
145
-
146
-
147
-
148
-
149
-
150
-
151
-
152
-
153
-
154
-
155
-
156
-
157
-
158
-
159
-
160
-
161
-
162
-
163
-
164
-
165
-
166
-
167
-
168
-
169
-
170
-
171
-
172
-
173
-
174
-
175
-
176
-
 177
177 -
 178
178 -
 179
179 -
 180
180 -
 181
181 -
 182
182 -
 183
183 -
 184
184 -
 185
185 -
 186
186 -
 187
187 -
 188
188 -
 189
189 -
 190
190 -
 191
191 -
 192
192 -
 193
193 -
 194
194 -
 195
195 -
 196
196 -
 197
197 -
198
-
199
-
200
-
201
-
202
-
203
-
204
-
205
-
206
-
207
-
208
-
209
-
210
-
211
-
212
-
213
-
214
-
215
-
216
-
217
-
218
-
219
-
220
-
221
-
222
-
223
-
224
-
225
-
226
-
227
-
228
-
229
-
230
-
231
-
232
-
233
-
234
-
235
-
236
-
237
-
238
-
239
-
240
-
241
-
242
-
243
-
244
-
245
-
246
-
247
-
248
-
249
-
250
-
251
-
252
-
253
-
254
-
255
-
256
-
257
-
258
-
259
-
260
-
261
-
262
-
263
-
264
-
265
-
266
-
267
-
268
-
269
-
270
-
271
-
272
-
273
-
274
-
275
-
276
-
277
-
278
-
279
-
280
-
281
-
282
-
283
-
284
-
285
-
286
-
287
-
288
-
289
-
290
-
291
-
292
-
293
-
294
-
295
-
296
-
297
-
298
-
299
-
300
-
301
-
302
-
303
-
304
-
305
-
306
-
307
-
308
-
309
-
310
-
311
-
312
-
313
-
314
-
315
-
316
-
317
-
318
-
319
-
320
-
321
-
322
-
323
-
324
-
325
-
326
-
327
-
328
-
329
-
330
-
331
-
332
-
333
-
334
-
335
-
336
-
337
-
338
-
339
-
340
-
341
-
342
-
343
-
344
-
345
-
346
-
347
-
348
-
349
-
350
-
351
-
352
-
353
-
354
-
355
-
356
-
357
-
358
-
359
-
360
-
361
-
362
-
363
-
364
-
365
-
366
-
367
-
368
-
369
-
370
-
371
-
372
 |
 |

253 D. Consolidated Financial Statements
357 E. Additional Information
245 C. Compensation Report, Corporate Governance
statement pursuant to Section a of the
German Commercial Code, Takeover-relevant
information and explanatory report
246 C. Siemens AG ( Discussion on basis of
German Commercial Code)
250 C. Notes and forward-looking statements
Profit and Profit margin by Business
Profit Profit margin
Year ended September , Year ended September ,
(in millions of €) % Change
Industry Automation 1,038 1,316 (21)% 12.7% 15.6%
Drive Technologies 527 970 (46)% 5.7% 10.1%
Profit at Industry Automation declined substantially year-
over year, due in part to € million in charges for “Siemens
.” Continuing softness in the Division’s short-cycle mar-
kets led to lower revenue year-over-year and reduced capacity
utilization. The Division took measures to improve its busi-
ness mix via a ramp-down of certain low-margin activities, in-
cluding the solar inverter business. In contrast, the Division’s
industrial IT and software business contributed revenue and
order growth year-over-year, due in part to recent acquisitions
including LMS. Revenue for the Division overall came in %
below the prior year, on declines in the Americas and Europe,
C.I.S., Africa, Middle East. The Division’s moderate decline in
orders year-over-year was evident in all three reporting re-
gions, led by a clear decrease in the Americas.
In addition, the Division took PPA effects related to long-lived
assets of LMS, which totaled € million for the year. Effects
from deferred revenue adjustments and inventory step-ups re-
lated to LMS totaled an additional € million. Both fiscal years
under review included PPA effects from the acquisition of UGS
Corp., acquired in fiscal . These effects were € million
in fiscal and € million a year earlier.
Profit at Drive Technologies in fiscal came in at € mil-
lion, a sharp decline from the prior-year level. The main impact
was € million in charges for “Siemens .” Profit develop-
ment also included a revenue-driven decline due to challeng-
ing market conditions for the Division’s higher-margin
short-cycle businesses and its offerings for renewable energy.
On a geographic basis, both orders and revenue declined mod-
erately on lower volume in all three reporting regions, particu-
larly including Asia, Australia which showed a clear decline
year-over-year.
C... INFRASTRUCTURE & CITIES
Sector
Year ended September , % Change therein
(in millions of €) Actual Adjusted Currency Portfolio
Profit 306 1,102 (72)%
Profit margin 1.7% 6.3%
Orders 21,894 17,150 28% 28% (3)% 2%
Total revenue 17,879 17,585 2% 1% (1)% 2%
External revenue 17,128 16,731 2%
therein:
Europe, C.I.S., Africa, Middle East 10,482 10,121 4%
therein Germany 2,633 2,880 (9)%
Americas 4,283 4,344 (1)%
Asia, Australia 2,363 2,267 4%
1 Excluding currency translation and portfolio effects. 2 Commonwealth of Independent States.
Profit at Infrastructure & Cities came in at € million in fis-
cal , down from €. billion a year earlier. The biggest
factor in this decline year-over-year was € million in
“Siemens ” charges, taken primarily to improve the Sec-
tor’s cost efficiency and regional footprint. These charges led
to declines in profit at Power Grid Solutions & Products and
Building Technologies, which otherwise showed strong profit
performances. Transportation & Logistics took the largest part
of the Sector’s “Siemens ” charges. Furthermore, its profit
was impacted by project charges of € million related to
high-speed trains. In the prior fiscal year, charges related to
these matters were sharply lower at € million. Transaction