Siemens 2013 Annual Report Download - page 190
Download and view the complete annual report
Please find page 190 of the 2013 Siemens annual report below. You can navigate through the pages in the report by either clicking on the pages listed below, or by using the keyword search tool below to find specific information within the annual report.-
 1
1 -
2
-
3
-
4
-
5
-
6
-
7
-
8
-
9
-
10
-
11
-
12
-
13
-
14
-
15
-
16
-
17
-
18
-
19
-
20
-
21
-
22
-
23
-
24
-
25
-
26
-
27
-
28
-
29
-
30
-
31
-
32
-
33
-
34
-
35
-
36
-
37
-
38
-
39
-
40
-
41
-
42
-
43
-
44
-
45
-
46
-
47
-
48
-
49
-
50
-
51
-
52
-
53
-
54
-
55
-
56
-
57
-
58
-
59
-
60
-
61
-
62
-
63
-
64
-
65
-
66
-
67
-
68
-
69
-
70
-
71
-
72
-
73
-
74
-
75
-
76
-
77
-
78
-
79
-
80
-
81
-
82
-
83
-
84
-
85
-
86
-
87
-
88
-
89
-
90
-
91
-
92
-
93
-
94
-
95
-
96
-
97
-
98
-
99
-
100
-
101
-
102
-
103
-
104
-
105
-
106
-
107
-
108
-
109
-
110
-
111
-
112
-
113
-
114
-
115
-
116
-
117
-
118
-
119
-
120
-
121
-
122
-
123
-
124
-
125
-
126
-
127
-
128
-
129
-
130
-
131
-
132
-
133
-
134
-
135
-
136
-
137
-
138
-
139
-
140
-
141
-
142
-
143
-
144
-
145
-
146
-
147
-
148
-
149
-
150
-
151
-
152
-
153
-
154
-
155
-
156
-
157
-
158
-
159
-
160
-
161
-
162
-
163
-
164
-
165
-
166
-
167
-
168
-
169
-
170
-
171
-
172
-
173
-
174
-
175
-
176
-
177
-
178
-
179
-
 180
180 -
 181
181 -
 182
182 -
 183
183 -
 184
184 -
 185
185 -
 186
186 -
 187
187 -
 188
188 -
 189
189 -
 190
190 -
 191
191 -
 192
192 -
 193
193 -
 194
194 -
 195
195 -
 196
196 -
 197
197 -
 198
198 -
 199
199 -
 200
200 -
201
-
202
-
203
-
204
-
205
-
206
-
207
-
208
-
209
-
210
-
211
-
212
-
213
-
214
-
215
-
216
-
217
-
218
-
219
-
220
-
221
-
222
-
223
-
224
-
225
-
226
-
227
-
228
-
229
-
230
-
231
-
232
-
233
-
234
-
235
-
236
-
237
-
238
-
239
-
240
-
241
-
242
-
243
-
244
-
245
-
246
-
247
-
248
-
249
-
250
-
251
-
252
-
253
-
254
-
255
-
256
-
257
-
258
-
259
-
260
-
261
-
262
-
263
-
264
-
265
-
266
-
267
-
268
-
269
-
270
-
271
-
272
-
273
-
274
-
275
-
276
-
277
-
278
-
279
-
280
-
281
-
282
-
283
-
284
-
285
-
286
-
287
-
288
-
289
-
290
-
291
-
292
-
293
-
294
-
295
-
296
-
297
-
298
-
299
-
300
-
301
-
302
-
303
-
304
-
305
-
306
-
307
-
308
-
309
-
310
-
311
-
312
-
313
-
314
-
315
-
316
-
317
-
318
-
319
-
320
-
321
-
322
-
323
-
324
-
325
-
326
-
327
-
328
-
329
-
330
-
331
-
332
-
333
-
334
-
335
-
336
-
337
-
338
-
339
-
340
-
341
-
342
-
343
-
344
-
345
-
346
-
347
-
348
-
349
-
350
-
351
-
352
-
353
-
354
-
355
-
356
-
357
-
358
-
359
-
360
-
361
-
362
-
363
-
364
-
365
-
366
-
367
-
368
-
369
-
370
-
371
-
372
 |
 |

92 A. To our Shareholders
117 B. Corporate Governance 155 C. Combined Management Report
156 C. Business and economic environment
173 C. Financial performance system
179 C. Results of operations
192 C. Financial position
204 C. Net assets position
207 C. Overall assessment of the economic position
209 C. Subsequent events
210 C. Sustainability
227 C. Report on expected developments and
associated material opportunities and risks
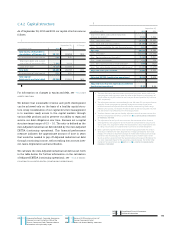
For the fiscal years ended September 30, 2013 and 2012
ProfitIncome (loss) from
investments accounted
for using the equity
method, net
(in millions of €)
Sectors
Energy Sector 1,955 1,901 (39) 22
therein: Fossil Power Generation 1,693 1,933 32 41
Wind Power 306 304 (8) 6
Oil & Gas 433 218 ––
Power Transmission (156) (302) 20 25
Healthcare Sector 2,048 1,815 88
therein: Diagnostics 350 314 ––
Industry Sector 1,478 2,448 (4) 11
therein: Industry Automation 1,038 1,316 –1
Drive Technologies 527 970 (5) 10
Infrastructure & Cities Sector 306 1,102 26 25
therein: Transportation & Logistics (448) 236 18 15
Power Grid Solutions & Products 403 457 89
Building Technologies 351 379 –1
Total Sectors 5,788 7,266 (10) 66
Equity Investments 396 (549) 372 (568)
Financial Services (SFS) 409 479 85 168
Reconciliation to Consolidated Financial Statements
Centrally managed portfolio activities (12) (29) 69 7
Siemens Real Estate (SRE) 171 115 ––
Corporate items and pensions (839) (668) ––
Eliminations, Corporate Treasury and other reconciling items (70) 23 (6) (5)
Siemens 5,843 6,636 510 (333)
1 Profit of the Sectors as well as of Equity Investments and
Centrally managed portfolio activities is earnings before
financing interest, certain pension costs and income
taxes. Certain other items not considered performance
indicative by Management may be excluded. Profit of
SFS and SRE is Income before income taxes. Profit of
Siemens is Income from continuing operations before
income taxes. For a reconciliation of Income from
continuing operations before income taxes to Net in-
come see D. CONSOLIDATED STATEMENTS OF INCOME.
2 Includes impairments and reversals of impairments of
investments accounted for using the equity method.
3 Includes impairment of non-current available-for-sale
financial assets. For Siemens, Financial income (ex-
penses), net comprises Interest income, Interest ex-
penses and Other financial income (expenses), net as
reported in the Consolidated Statements of Income.
C.. Reconciliation to adjusted EBITDA (continuing operations)
The following table gives additional information on topics in-
cluded in Profit and Income before income taxes and provides
a reconciliation to adjusted EBITDA based on continuing opera-
tions. We report adjusted EBIT and adjusted EBITDA as a perfor-
mance measure. The closest comparable GAAP figure under
IFRS is Net income as reported in our “Consolidated Statements
of Income.” For further information regarding adjusted EBIT
and adjusted EBITDA, please see C. NOTES AND FORWARD-
LOOKING STATEMENTS.