Siemens 2013 Annual Report Download - page 167
Download and view the complete annual report
Please find page 167 of the 2013 Siemens annual report below. You can navigate through the pages in the report by either clicking on the pages listed below, or by using the keyword search tool below to find specific information within the annual report.-
 1
1 -
2
-
3
-
4
-
5
-
6
-
7
-
8
-
9
-
10
-
11
-
12
-
13
-
14
-
15
-
16
-
17
-
18
-
19
-
20
-
21
-
22
-
23
-
24
-
25
-
26
-
27
-
28
-
29
-
30
-
31
-
32
-
33
-
34
-
35
-
36
-
37
-
38
-
39
-
40
-
41
-
42
-
43
-
44
-
45
-
46
-
47
-
48
-
49
-
50
-
51
-
52
-
53
-
54
-
55
-
56
-
57
-
58
-
59
-
60
-
61
-
62
-
63
-
64
-
65
-
66
-
67
-
68
-
69
-
70
-
71
-
72
-
73
-
74
-
75
-
76
-
77
-
78
-
79
-
80
-
81
-
82
-
83
-
84
-
85
-
86
-
87
-
88
-
89
-
90
-
91
-
92
-
93
-
94
-
95
-
96
-
97
-
98
-
99
-
100
-
101
-
102
-
103
-
104
-
105
-
106
-
107
-
108
-
109
-
110
-
111
-
112
-
113
-
114
-
115
-
116
-
117
-
118
-
119
-
120
-
121
-
122
-
123
-
124
-
125
-
126
-
127
-
128
-
129
-
130
-
131
-
132
-
133
-
134
-
135
-
136
-
137
-
138
-
139
-
140
-
141
-
142
-
143
-
144
-
145
-
146
-
147
-
148
-
149
-
150
-
151
-
152
-
153
-
154
-
155
-
156
-
 157
157 -
 158
158 -
 159
159 -
 160
160 -
 161
161 -
 162
162 -
 163
163 -
 164
164 -
 165
165 -
 166
166 -
 167
167 -
 168
168 -
 169
169 -
 170
170 -
 171
171 -
 172
172 -
 173
173 -
 174
174 -
 175
175 -
 176
176 -
 177
177 -
178
-
179
-
180
-
181
-
182
-
183
-
184
-
185
-
186
-
187
-
188
-
189
-
190
-
191
-
192
-
193
-
194
-
195
-
196
-
197
-
198
-
199
-
200
-
201
-
202
-
203
-
204
-
205
-
206
-
207
-
208
-
209
-
210
-
211
-
212
-
213
-
214
-
215
-
216
-
217
-
218
-
219
-
220
-
221
-
222
-
223
-
224
-
225
-
226
-
227
-
228
-
229
-
230
-
231
-
232
-
233
-
234
-
235
-
236
-
237
-
238
-
239
-
240
-
241
-
242
-
243
-
244
-
245
-
246
-
247
-
248
-
249
-
250
-
251
-
252
-
253
-
254
-
255
-
256
-
257
-
258
-
259
-
260
-
261
-
262
-
263
-
264
-
265
-
266
-
267
-
268
-
269
-
270
-
271
-
272
-
273
-
274
-
275
-
276
-
277
-
278
-
279
-
280
-
281
-
282
-
283
-
284
-
285
-
286
-
287
-
288
-
289
-
290
-
291
-
292
-
293
-
294
-
295
-
296
-
297
-
298
-
299
-
300
-
301
-
302
-
303
-
304
-
305
-
306
-
307
-
308
-
309
-
310
-
311
-
312
-
313
-
314
-
315
-
316
-
317
-
318
-
319
-
320
-
321
-
322
-
323
-
324
-
325
-
326
-
327
-
328
-
329
-
330
-
331
-
332
-
333
-
334
-
335
-
336
-
337
-
338
-
339
-
340
-
341
-
342
-
343
-
344
-
345
-
346
-
347
-
348
-
349
-
350
-
351
-
352
-
353
-
354
-
355
-
356
-
357
-
358
-
359
-
360
-
361
-
362
-
363
-
364
-
365
-
366
-
367
-
368
-
369
-
370
-
371
-
372
 |
 |

253 D. Consolidated Financial Statements
357 E. Additional Information
245 C. Compensation Report, Corporate Governance
statement pursuant to Section a of the
German Commercial Code, Takeover-relevant
information and explanatory report
246 C. Siemens AG ( Discussion on basis of
German Commercial Code)
250 C. Notes and forward-looking statements
countries was decreasing below historical trends. Despite some
moderation in commodity prices, GDP growth in Africa picked
up slightly.
However, uncertainty on the economic and political
fronts poses a continuing threat to African economic develop-
ment. Economic activity in the C.I.S. countries, which is mainly
determined by its largest member, Russia, was weak again in
. Similar to some other emerging countries, Russia suf-
fered from a reversal of capital flows out of the country. In sum,
the region Europe, C.I.S., Africa and Middle East in is proj-
ected to grow at nearly the same modest rate of % as in .
Investment spending performed even worse: it contracted %
in , after it had already shrunk .% in . Value added
manufacturing also stagnated in after a decline in .
The Americas region saw significantly slower growth in :
GDP increased .%, after growth of .% in . The U.S. was
the main factor, due to budget tightening measures (the “se-
quester”) which started at the beginning of calendar .
According to an International Monetary Fund estimate, the
sequester reduced the country ’s growth rate by as much
as . percentage points. Accordingly, GDP figures for the U.S.
are masking a gradual improvement in the private sector. For
example, the construction sector was recovering further, con-
sumer spending was growing moderately, and fixed invest-
ments – which were affected most by the political uncertain-
ties and even went to negative growth at the beginning of
– were picking up. Monetary policy continued to be very
expansionary, although fears of a gradual reduction (“taper-
ing”) of “quantitative easing” measures caused long-term inter-
est rates to rise. Latin American growth was low and roughly
unchanged compared to . After a very low GDP increase of
.% in , the Brazilian economy accelerated modestly to
.% in . Because the Brazilian economy is estimated to
operate near its potential, supply-side constraints have held
back growth and exacerbated inflationary pressures. For the
Americas region overall, growth of investment spending and
value-added manufacturing both slowed in : fixed invest-
ment growth from .% in to .% in , value-added
manufacturing from .% to .%.
In Asia, Australia GDP growth in is expected to remain at
.%, virtually the same level as in the two previous years. In
the first half of , the Chinese economy continued to slow
down to .% GDP growth year-over-year because global de-
mand for Chinese products was weaker and concerns emerged
about the health of the country ’s financial system and the sus-
tainability of its public debt. India had to deal with even more
severe problems. The slowing economy, a current account
deficit, high inflation and unresolved structural problems
caused foreign capital to exit the country and the Rupee to
lose one fifth of its value against the U.S. dollar within one
year. These adverse developments for the Asia, Australia re-
gion were counterbalanced by the recovery of the Japanese
economy. The government’s unusual measures to kick-start
the Japanese economy out of its deflationary spiral seem to be
successful: GDP expanded by a % annual rate in the first half
of . Although GDP growth for the Asia, Australia region re-
mained stable in , growth of fixed investment and value-
added manufacturing slowed by roughly one percentage
point, to .% and .%, respectively compared to .
The partly estimated figures presented here for gross domestic
product, fixed investments and manufacturing value added
are calculated by Siemens AG based on an IHS Global Insight
report dated October , .
Our businesses are dependent on the development of raw ma-
terial prices. Key materials to which we have significant cost
exposure include copper, various grades and formats of steel
and aluminum. In addition, within stainless steel we have ex-
posure related to nickel and ferro-alloy materials.
The average monthly price of copper (denominated in € per
metric ton) for September was % lower than the average
monthly price in September , reflecting a more moderate
economic sentiment during fiscal and increasing produc-
tion from new or extended mine projects. Prices on a fiscal-
year average were % lower in fiscal than the average for
fiscal . Because copper is produced in multiple locations
and traded in multiple locations, such as the London Metal
Exchange, the risk to Siemens is primarily a price risk rather
than a supply risk.
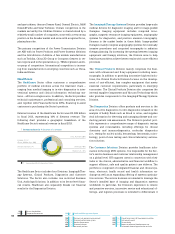
Real GDP growth per region (change in % compared to prior year)
World Europe, C.I.S.,
Africa,
Middle East
Americas Asia,
Australia
1 Source: Siemens AG, based on an IHS Global Insight as of October , .
Growth rates provided by calendar year.
2 Estimate for calendar year .
3 Commonwealth of Independent States.
2.4
1.0
1.8
4.8
2.7
1.1
2.7
4.7