Siemens 2013 Annual Report Download - page 191
Download and view the complete annual report
Please find page 191 of the 2013 Siemens annual report below. You can navigate through the pages in the report by either clicking on the pages listed below, or by using the keyword search tool below to find specific information within the annual report.-
 1
1 -
2
-
3
-
4
-
5
-
6
-
7
-
8
-
9
-
10
-
11
-
12
-
13
-
14
-
15
-
16
-
17
-
18
-
19
-
20
-
21
-
22
-
23
-
24
-
25
-
26
-
27
-
28
-
29
-
30
-
31
-
32
-
33
-
34
-
35
-
36
-
37
-
38
-
39
-
40
-
41
-
42
-
43
-
44
-
45
-
46
-
47
-
48
-
49
-
50
-
51
-
52
-
53
-
54
-
55
-
56
-
57
-
58
-
59
-
60
-
61
-
62
-
63
-
64
-
65
-
66
-
67
-
68
-
69
-
70
-
71
-
72
-
73
-
74
-
75
-
76
-
77
-
78
-
79
-
80
-
81
-
82
-
83
-
84
-
85
-
86
-
87
-
88
-
89
-
90
-
91
-
92
-
93
-
94
-
95
-
96
-
97
-
98
-
99
-
100
-
101
-
102
-
103
-
104
-
105
-
106
-
107
-
108
-
109
-
110
-
111
-
112
-
113
-
114
-
115
-
116
-
117
-
118
-
119
-
120
-
121
-
122
-
123
-
124
-
125
-
126
-
127
-
128
-
129
-
130
-
131
-
132
-
133
-
134
-
135
-
136
-
137
-
138
-
139
-
140
-
141
-
142
-
143
-
144
-
145
-
146
-
147
-
148
-
149
-
150
-
151
-
152
-
153
-
154
-
155
-
156
-
157
-
158
-
159
-
160
-
161
-
162
-
163
-
164
-
165
-
166
-
167
-
168
-
169
-
170
-
171
-
172
-
173
-
174
-
175
-
176
-
177
-
178
-
179
-
180
-
 181
181 -
 182
182 -
 183
183 -
 184
184 -
 185
185 -
 186
186 -
 187
187 -
 188
188 -
 189
189 -
 190
190 -
 191
191 -
 192
192 -
 193
193 -
 194
194 -
 195
195 -
 196
196 -
 197
197 -
 198
198 -
 199
199 -
 200
200 -
 201
201 -
202
-
203
-
204
-
205
-
206
-
207
-
208
-
209
-
210
-
211
-
212
-
213
-
214
-
215
-
216
-
217
-
218
-
219
-
220
-
221
-
222
-
223
-
224
-
225
-
226
-
227
-
228
-
229
-
230
-
231
-
232
-
233
-
234
-
235
-
236
-
237
-
238
-
239
-
240
-
241
-
242
-
243
-
244
-
245
-
246
-
247
-
248
-
249
-
250
-
251
-
252
-
253
-
254
-
255
-
256
-
257
-
258
-
259
-
260
-
261
-
262
-
263
-
264
-
265
-
266
-
267
-
268
-
269
-
270
-
271
-
272
-
273
-
274
-
275
-
276
-
277
-
278
-
279
-
280
-
281
-
282
-
283
-
284
-
285
-
286
-
287
-
288
-
289
-
290
-
291
-
292
-
293
-
294
-
295
-
296
-
297
-
298
-
299
-
300
-
301
-
302
-
303
-
304
-
305
-
306
-
307
-
308
-
309
-
310
-
311
-
312
-
313
-
314
-
315
-
316
-
317
-
318
-
319
-
320
-
321
-
322
-
323
-
324
-
325
-
326
-
327
-
328
-
329
-
330
-
331
-
332
-
333
-
334
-
335
-
336
-
337
-
338
-
339
-
340
-
341
-
342
-
343
-
344
-
345
-
346
-
347
-
348
-
349
-
350
-
351
-
352
-
353
-
354
-
355
-
356
-
357
-
358
-
359
-
360
-
361
-
362
-
363
-
364
-
365
-
366
-
367
-
368
-
369
-
370
-
371
-
372
 |
 |

253 D. Consolidated Financial Statements
357 E. Additional Information
245 C. Compensation Report, Corporate Governance
statement pursuant to Section a of the
German Commercial Code, Takeover-relevant
information and explanatory report
246 C. Siemens AG ( Discussion on basis of
German Commercial Code)
250 C. Notes and forward-looking statements
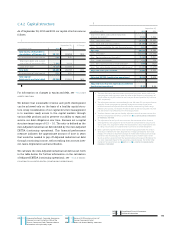
Financial income
(expenses), net
Adjusted EBITAmortizationDepreciation and
impairments of property,
plant and equipment
and goodwill
Adjusted EBITDA Adjusted EBITDA margin
(27) 44 2,022 1,835 132 97 478 537 2,631 2,470 9.9% 8.9%
(13) 67 1,674 1,825 19 21 143 142 1,835 1,988
(6) (5) 320 303 32 27 103 100 454 430
(3) (4) 436 222 49 38 79 71 564 330
(10) (20) (167) (308) 13 11 114 109 (39) (187)
(18) 22,059 1,804 314 377 323 349 2,696 2,530 19.8% 18.5%
(27) 9377 305 196 232 211 226 784 763
(17) (14) 1,499 2,452 303 253 354 300 2,156 3,005 11.6% 15.5%
(4) (7) 1,041 1,323 240 195 123 114 1,404 1,631
(11) (6) 542 966 56 48 219 172 817 1,187
229 278 1,048 154 112 226 165 657 1,324 3.7% 7.5%
(7) (16) (459) 236 39 13 99 46 (321) 296
(6) (4) 401 452 57 39 78 71 536 562
–(2) 352 381 58 60 46 47 456 488
(60) 61 5,858 7,139 902 839 1,381 1,350 8,141 9,329
7717 12 ––––17 12
389 385 (64) (73) 57225 264 166 197
(2) –(80) (36) 2422(76) (31)
(110) (112) 281 227 12313 325 595 553
(249) (305) (590) (363) 17 16 74 51 (499) (296)
30 137 (94) (109) ––(34) (41) (128) (151)
5173 5,328 6,796 927 867 1,960 1,950 8,215 9,613
4 Adjusted EBIT is Income from continuing operations before
income taxes less Financial income (expenses), net and
Income (loss) from investments accounted for using the
equity method, net.
5 Amortization and impairments, net of reversals,
of intangible assets other than goodwill.
6 Depreciation and impairments of property, plant and
equipment, net of reversals. Includes impairments of
goodwill of € million in the current period and €
million in the prior-year period, respectively.