Siemens 2013 Annual Report Download - page 194
Download and view the complete annual report
Please find page 194 of the 2013 Siemens annual report below. You can navigate through the pages in the report by either clicking on the pages listed below, or by using the keyword search tool below to find specific information within the annual report.-
 1
1 -
2
-
3
-
4
-
5
-
6
-
7
-
8
-
9
-
10
-
11
-
12
-
13
-
14
-
15
-
16
-
17
-
18
-
19
-
20
-
21
-
22
-
23
-
24
-
25
-
26
-
27
-
28
-
29
-
30
-
31
-
32
-
33
-
34
-
35
-
36
-
37
-
38
-
39
-
40
-
41
-
42
-
43
-
44
-
45
-
46
-
47
-
48
-
49
-
50
-
51
-
52
-
53
-
54
-
55
-
56
-
57
-
58
-
59
-
60
-
61
-
62
-
63
-
64
-
65
-
66
-
67
-
68
-
69
-
70
-
71
-
72
-
73
-
74
-
75
-
76
-
77
-
78
-
79
-
80
-
81
-
82
-
83
-
84
-
85
-
86
-
87
-
88
-
89
-
90
-
91
-
92
-
93
-
94
-
95
-
96
-
97
-
98
-
99
-
100
-
101
-
102
-
103
-
104
-
105
-
106
-
107
-
108
-
109
-
110
-
111
-
112
-
113
-
114
-
115
-
116
-
117
-
118
-
119
-
120
-
121
-
122
-
123
-
124
-
125
-
126
-
127
-
128
-
129
-
130
-
131
-
132
-
133
-
134
-
135
-
136
-
137
-
138
-
139
-
140
-
141
-
142
-
143
-
144
-
145
-
146
-
147
-
148
-
149
-
150
-
151
-
152
-
153
-
154
-
155
-
156
-
157
-
158
-
159
-
160
-
161
-
162
-
163
-
164
-
165
-
166
-
167
-
168
-
169
-
170
-
171
-
172
-
173
-
174
-
175
-
176
-
177
-
178
-
179
-
180
-
181
-
182
-
183
-
 184
184 -
 185
185 -
 186
186 -
 187
187 -
 188
188 -
 189
189 -
 190
190 -
 191
191 -
 192
192 -
 193
193 -
 194
194 -
 195
195 -
 196
196 -
 197
197 -
 198
198 -
 199
199 -
 200
200 -
 201
201 -
 202
202 -
 203
203 -
 204
204 -
205
-
206
-
207
-
208
-
209
-
210
-
211
-
212
-
213
-
214
-
215
-
216
-
217
-
218
-
219
-
220
-
221
-
222
-
223
-
224
-
225
-
226
-
227
-
228
-
229
-
230
-
231
-
232
-
233
-
234
-
235
-
236
-
237
-
238
-
239
-
240
-
241
-
242
-
243
-
244
-
245
-
246
-
247
-
248
-
249
-
250
-
251
-
252
-
253
-
254
-
255
-
256
-
257
-
258
-
259
-
260
-
261
-
262
-
263
-
264
-
265
-
266
-
267
-
268
-
269
-
270
-
271
-
272
-
273
-
274
-
275
-
276
-
277
-
278
-
279
-
280
-
281
-
282
-
283
-
284
-
285
-
286
-
287
-
288
-
289
-
290
-
291
-
292
-
293
-
294
-
295
-
296
-
297
-
298
-
299
-
300
-
301
-
302
-
303
-
304
-
305
-
306
-
307
-
308
-
309
-
310
-
311
-
312
-
313
-
314
-
315
-
316
-
317
-
318
-
319
-
320
-
321
-
322
-
323
-
324
-
325
-
326
-
327
-
328
-
329
-
330
-
331
-
332
-
333
-
334
-
335
-
336
-
337
-
338
-
339
-
340
-
341
-
342
-
343
-
344
-
345
-
346
-
347
-
348
-
349
-
350
-
351
-
352
-
353
-
354
-
355
-
356
-
357
-
358
-
359
-
360
-
361
-
362
-
363
-
364
-
365
-
366
-
367
-
368
-
369
-
370
-
371
-
372
 |
 |

92 A. To our Shareholders
117 B. Corporate Governance 155 C. Combined Management Report
156 C. Business and economic environment
173 C. Financial performance system
179 C. Results of operations
192 C. Financial position
204 C. Net assets position
207 C. Overall assessment of the economic position
209 C. Subsequent events
210 C. Sustainability
227 C. Report on expected developments and
associated material opportunities and risks
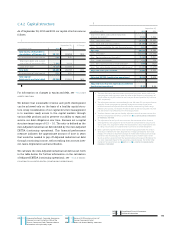
SFS’ capital structure differs from the capital structure for our
industrial business, because SFS’ business is capital-intensive
and requires larger amounts of debt to finance its operations,
in particular to finance its asset growth strategy. The following
table provides information on the capital structure of SFS as of
September , and :
(in millions of €)
September ,
Allocated equity 1,938 1,790
SFS Debt 15,600 14,558
Debt to equity ratio 8.05 8.13
For purposes of measuring capital efficiency at SFS, equity
capital is allocated to SFS. Allocated equity capital differs from
book capital as it is mainly determined and influenced by the
size and quality of its portfolio of commercial finance assets,
project and structured finance assets (primarily loans and leas-
es) and equity investments. This allocation is designed to cov-
er the risks of the underlying business. The actual risk of the
SFS portfolio is evaluated and controlled on a regular basis.
The allocated equity is calculated quarterly.
In August we announced, that we would adjust our capi-
tal structure through share buybacks amounting to up to €
billion by December , . In fiscal , we repurchased
,, treasury shares at a weighted average share price
of €.. At the beginning of fiscal we repurchased a fur-
ther ,, treasury shares at a weighted average price of
€., and completed this share buyback program in Novem-
ber . In addition, in fiscal , we repurchased as many
treasury shares as necessary to keep the number of treasury
shares at a set level until the effective date of the spin-off of
OSRAM and fulfilled commitments for share-based compensa-
tion through treasury shares.
In November , we announced a new share buyback pro-
gram. We intend to repurchase shares of up to € billion in
volume within the next up to months. The program will
support our continued approach toward our capital structure
target. The shares repurchased may be used for the purposes
of cancellation and reduction of capital stock, issuances to
employees, board members of affiliated companies and mem-
bers of the Managing Board as well as to meet obligations
arising under and in connection with convertible bonds and
warrant bonds.
In fiscal , we may again fulfill commitments for share-
based compensation through treasury shares. For additional
information with respect to treasury shares, see NOTE in
D. NOTES TO CONSOLIDATED FINANCIAL STATEMENTS.
C.. Credit rating
A key factor in maintaining a strong financial profile is our
credit rating, which is affected by, among other factors, our
capital structure, profitability, ability to generate cash flow,
geographic and product diversification and our competitive
market position. Our current corporate credit ratings from
Moody ’s Investors Service (Moody ’s) and Standard & Poor’s
Ratings Services (S&P) are noted as follows:
Moody’s S&P
Long-term debt Aa3 A +
Short-term debt P-1 A -1+
On May , , Moody ’s changed its outlook for Siemens’
credit rating from “stable” to “negative,” stating that “despite the
group’s substantial cost reduction initiatives, we expect its prof-
itability, cash flow generation and capital structure to be weaker
than anticipated in and .” A rating outlook is an opin-
ion regarding the likely direction of an issuer’s long-term credit
rating over the medium-term. Rating outlooks of Moody ’s fall
into the following six categories: “positive,” “negative,” “stable,”
“developing,” “ratings under review” or “no outlook.”
At the same time, Moody ’s affirmed our “Aa” long-term and
our “P-” short-term credit ratings. The classification “Aa” is the
second highest category within Moody ’s long-term credit rat-
ing scale. The numerical modifier “” indicates a ranking in the
lower end of that category. The classification “P-” is the high-
est available rating in the prime rating system of Moody ’s,
which assesses issuers’ ability to honor senior financial obliga-
tions and contracts. It applies to senior unsecured obligations
with an original maturity of less than one year.
S&P made no rating changes in fiscal . S&P’s long-term
credit rating for Siemens is “A+” and the rating outlook is “sta-
ble.” Within S&P’s long-term credit rating scale, “A” is the
third-highest long-term rating category. The modifier “+” indi-
cates that our long-term debt ranks in the upper end of the “A”
category. Rating outlooks of S&P fall into the following four
categories: “positive,” ”negative,” ”stable” or “developing.” S&P’s