Siemens 2013 Annual Report Download - page 183
Download and view the complete annual report
Please find page 183 of the 2013 Siemens annual report below. You can navigate through the pages in the report by either clicking on the pages listed below, or by using the keyword search tool below to find specific information within the annual report.-
 1
1 -
2
-
3
-
4
-
5
-
6
-
7
-
8
-
9
-
10
-
11
-
12
-
13
-
14
-
15
-
16
-
17
-
18
-
19
-
20
-
21
-
22
-
23
-
24
-
25
-
26
-
27
-
28
-
29
-
30
-
31
-
32
-
33
-
34
-
35
-
36
-
37
-
38
-
39
-
40
-
41
-
42
-
43
-
44
-
45
-
46
-
47
-
48
-
49
-
50
-
51
-
52
-
53
-
54
-
55
-
56
-
57
-
58
-
59
-
60
-
61
-
62
-
63
-
64
-
65
-
66
-
67
-
68
-
69
-
70
-
71
-
72
-
73
-
74
-
75
-
76
-
77
-
78
-
79
-
80
-
81
-
82
-
83
-
84
-
85
-
86
-
87
-
88
-
89
-
90
-
91
-
92
-
93
-
94
-
95
-
96
-
97
-
98
-
99
-
100
-
101
-
102
-
103
-
104
-
105
-
106
-
107
-
108
-
109
-
110
-
111
-
112
-
113
-
114
-
115
-
116
-
117
-
118
-
119
-
120
-
121
-
122
-
123
-
124
-
125
-
126
-
127
-
128
-
129
-
130
-
131
-
132
-
133
-
134
-
135
-
136
-
137
-
138
-
139
-
140
-
141
-
142
-
143
-
144
-
145
-
146
-
147
-
148
-
149
-
150
-
151
-
152
-
153
-
154
-
155
-
156
-
157
-
158
-
159
-
160
-
161
-
162
-
163
-
164
-
165
-
166
-
167
-
168
-
169
-
170
-
171
-
172
-
 173
173 -
 174
174 -
 175
175 -
 176
176 -
 177
177 -
 178
178 -
 179
179 -
 180
180 -
 181
181 -
 182
182 -
 183
183 -
 184
184 -
 185
185 -
 186
186 -
 187
187 -
 188
188 -
 189
189 -
 190
190 -
 191
191 -
 192
192 -
 193
193 -
194
-
195
-
196
-
197
-
198
-
199
-
200
-
201
-
202
-
203
-
204
-
205
-
206
-
207
-
208
-
209
-
210
-
211
-
212
-
213
-
214
-
215
-
216
-
217
-
218
-
219
-
220
-
221
-
222
-
223
-
224
-
225
-
226
-
227
-
228
-
229
-
230
-
231
-
232
-
233
-
234
-
235
-
236
-
237
-
238
-
239
-
240
-
241
-
242
-
243
-
244
-
245
-
246
-
247
-
248
-
249
-
250
-
251
-
252
-
253
-
254
-
255
-
256
-
257
-
258
-
259
-
260
-
261
-
262
-
263
-
264
-
265
-
266
-
267
-
268
-
269
-
270
-
271
-
272
-
273
-
274
-
275
-
276
-
277
-
278
-
279
-
280
-
281
-
282
-
283
-
284
-
285
-
286
-
287
-
288
-
289
-
290
-
291
-
292
-
293
-
294
-
295
-
296
-
297
-
298
-
299
-
300
-
301
-
302
-
303
-
304
-
305
-
306
-
307
-
308
-
309
-
310
-
311
-
312
-
313
-
314
-
315
-
316
-
317
-
318
-
319
-
320
-
321
-
322
-
323
-
324
-
325
-
326
-
327
-
328
-
329
-
330
-
331
-
332
-
333
-
334
-
335
-
336
-
337
-
338
-
339
-
340
-
341
-
342
-
343
-
344
-
345
-
346
-
347
-
348
-
349
-
350
-
351
-
352
-
353
-
354
-
355
-
356
-
357
-
358
-
359
-
360
-
361
-
362
-
363
-
364
-
365
-
366
-
367
-
368
-
369
-
370
-
371
-
372
 |
 |

253 D. Consolidated Financial Statements
357 E. Additional Information
245 C. Compensation Report, Corporate Governance
statement pursuant to Section a of the
German Commercial Code, Takeover-relevant
information and explanatory report
246 C. Siemens AG ( Discussion on basis of
German Commercial Code)
250 C. Notes and forward-looking statements
C.. Segment information analysis
C... ENERGY
Energy reported a profit of €. billion in fiscal , up %
year-over-year. The Sector took € million in charges under
the “Siemens ” program, primarily for reducing its cost
structure, adjusting capacity and improving its regional foot-
print. Fossil Power Generation contributed lower earnings
than a year earlier, but still accounted for most of the Sector’s
profit and was the highest profit performer among all Siemens
Divisions. Profit at Oil & Gas increased year-over-year on sub-
stantially lower charges related to Iran. Wind Power’s profit re-
mained on the same level as in fiscal , despite € million
in charges related to turbine blades. Power Transmission cut
its loss nearly in half compared to the prior year, due mainly to
substantially lower charges mainly related to grid-connections
to offshore wind-farms. These charges totaled € million in
fiscal compared to € million in fiscal . The solar
business was reclassified from discontinued operations to con-
tinuing operations in fiscal and is reported within Energy
on a retrospective basis. The loss from the solar business was
nearly unchanged year-over-year, at € million, compared to
€ million a year earlier. In the current fiscal year, the loss
included impairments and costs associated with the ramp-
down of the business of € million. In fiscal , the loss
included impairments of € million.
Revenue declined % compared to the prior-year period as
declines at Fossil Power Generation and Power Transmission
were only partially offset by increases at Wind Power and Oil &
Gas. On a regional basis, revenue rose in Europe, C.I.S., Africa,
Middle East and declined in other regions. Orders came in %
higher due mainly to large orders at Wind Power in Europe,
C.I.S., Africa, Middle East. Order intake was clearly higher in
the Americas, while orders declined significantly in the Asia,
Australia region. The book-to-bill ratio for Energy was ., and
its order backlog was € billion at the end of the fiscal year.
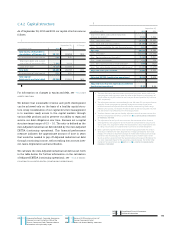
Sector
Year ended September , % Change therein
(in millions of €) Actual Adjusted Currency Portfolio
Profit 1,955 1,901 3%
Profit margin 7.3% 6.9%
Orders 28,797 26,930 7% 8% (2)% 1%
Total revenue 26,638 27,736 (4)% (3)% (2)% 0%
External revenue 26,386 27,501 (4)%
therein:
Europe, C.I.S., Africa, Middle East 14,346 14,261 1%
therein Germany 2,231 1,927 16%
Americas 7,153 8,141 (12)%
Asia, Australia 4,886 5,098 (4)%
1 Excluding currency translation and portfolio effects. 2 Commonwealth of Independent States.
Orders by Business
Year ended September , % Change therein
(in millions of €) Actual Adjusted Currency Portfolio
Fossil Power Generation 10,682 11,116 (4)% (2)% (2)% 0%
Wind Power 6,593 4,932 34% 34% (2)% 1%
Oil & Gas 5,801 5,307 9% 9% (2)% 2%
Power Transmission 5,700 5,824 (2)% 0% (2)% 0%
1 Excluding currency translation and portfolio effects.