Siemens 2013 Annual Report Download - page 198
Download and view the complete annual report
Please find page 198 of the 2013 Siemens annual report below. You can navigate through the pages in the report by either clicking on the pages listed below, or by using the keyword search tool below to find specific information within the annual report.-
 1
1 -
2
-
3
-
4
-
5
-
6
-
7
-
8
-
9
-
10
-
11
-
12
-
13
-
14
-
15
-
16
-
17
-
18
-
19
-
20
-
21
-
22
-
23
-
24
-
25
-
26
-
27
-
28
-
29
-
30
-
31
-
32
-
33
-
34
-
35
-
36
-
37
-
38
-
39
-
40
-
41
-
42
-
43
-
44
-
45
-
46
-
47
-
48
-
49
-
50
-
51
-
52
-
53
-
54
-
55
-
56
-
57
-
58
-
59
-
60
-
61
-
62
-
63
-
64
-
65
-
66
-
67
-
68
-
69
-
70
-
71
-
72
-
73
-
74
-
75
-
76
-
77
-
78
-
79
-
80
-
81
-
82
-
83
-
84
-
85
-
86
-
87
-
88
-
89
-
90
-
91
-
92
-
93
-
94
-
95
-
96
-
97
-
98
-
99
-
100
-
101
-
102
-
103
-
104
-
105
-
106
-
107
-
108
-
109
-
110
-
111
-
112
-
113
-
114
-
115
-
116
-
117
-
118
-
119
-
120
-
121
-
122
-
123
-
124
-
125
-
126
-
127
-
128
-
129
-
130
-
131
-
132
-
133
-
134
-
135
-
136
-
137
-
138
-
139
-
140
-
141
-
142
-
143
-
144
-
145
-
146
-
147
-
148
-
149
-
150
-
151
-
152
-
153
-
154
-
155
-
156
-
157
-
158
-
159
-
160
-
161
-
162
-
163
-
164
-
165
-
166
-
167
-
168
-
169
-
170
-
171
-
172
-
173
-
174
-
175
-
176
-
177
-
178
-
179
-
180
-
181
-
182
-
183
-
184
-
185
-
186
-
187
-
 188
188 -
 189
189 -
 190
190 -
 191
191 -
 192
192 -
 193
193 -
 194
194 -
 195
195 -
 196
196 -
 197
197 -
 198
198 -
 199
199 -
 200
200 -
 201
201 -
 202
202 -
 203
203 -
 204
204 -
 205
205 -
 206
206 -
 207
207 -
 208
208 -
209
-
210
-
211
-
212
-
213
-
214
-
215
-
216
-
217
-
218
-
219
-
220
-
221
-
222
-
223
-
224
-
225
-
226
-
227
-
228
-
229
-
230
-
231
-
232
-
233
-
234
-
235
-
236
-
237
-
238
-
239
-
240
-
241
-
242
-
243
-
244
-
245
-
246
-
247
-
248
-
249
-
250
-
251
-
252
-
253
-
254
-
255
-
256
-
257
-
258
-
259
-
260
-
261
-
262
-
263
-
264
-
265
-
266
-
267
-
268
-
269
-
270
-
271
-
272
-
273
-
274
-
275
-
276
-
277
-
278
-
279
-
280
-
281
-
282
-
283
-
284
-
285
-
286
-
287
-
288
-
289
-
290
-
291
-
292
-
293
-
294
-
295
-
296
-
297
-
298
-
299
-
300
-
301
-
302
-
303
-
304
-
305
-
306
-
307
-
308
-
309
-
310
-
311
-
312
-
313
-
314
-
315
-
316
-
317
-
318
-
319
-
320
-
321
-
322
-
323
-
324
-
325
-
326
-
327
-
328
-
329
-
330
-
331
-
332
-
333
-
334
-
335
-
336
-
337
-
338
-
339
-
340
-
341
-
342
-
343
-
344
-
345
-
346
-
347
-
348
-
349
-
350
-
351
-
352
-
353
-
354
-
355
-
356
-
357
-
358
-
359
-
360
-
361
-
362
-
363
-
364
-
365
-
366
-
367
-
368
-
369
-
370
-
371
-
372
 |
 |

92 A. To our Shareholders
117 B. Corporate Governance 155 C. Combined Management Report
156 C. Business and economic environment
173 C. Financial performance system
179 C. Results of operations
192 C. Financial position
204 C. Net assets position
207 C. Overall assessment of the economic position
209 C. Subsequent events
210 C. Sustainability
227 C. Report on expected developments and
associated material opportunities and risks
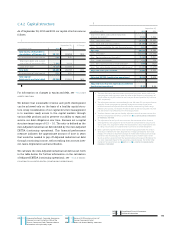
C.. Capital resources and requirements
Our capital resources consist of a variety of short- and long-
term financial instruments including, but not limited to, loans
from financial institutions, commercial paper, notes and
bonds, and credit facilities. In addition to cash and cash equiv-
alents and available-for-sale financial assets, liquid resources
consist of future cash flows from operating activities.
Our capital requirements include, among others, sched-
uled debt service, regular capital spending, ongoing cash
requirements from operating and SFS financing activities,
including cash outflows related to the growth strategy of
SFS, dividend payments, pension plan funding, portfolio ac-
tivities, and cash outflows in connection with “Siemens
,” a company-wide program aimed at improving profit-
ability in the Sectors.
C... DEBT AND CREDIT FACILITIES
Total debt comprises our Notes and bonds, Loans from banks,
Obligations under finance leases and Other financial indebted-
ness such as commercial paper. Total debt comprises Short-
term debt and current maturities of long-term debt as well as
Long-term debt, as stated on the Consolidated Statements of
Financial Position. Total liquidity refers to the liquid financial
assets we had available at the respective ends of the reporting
periods to fund our business operations and pay for near-term
obligations. Total liquidity comprises Cash and cash equiva-
lents as well as current Available-for-sale financial assets, as
stated on the Consolidated Statements of Financial Position.
Net debt results from total debt less total liquidity. Manage-
ment uses the Net debt measure for internal finance manage-
ment, as well as for external communication with investors,
analysts and rating agencies, and accordingly we believe that
presentation of Net debt is useful for those concerned. Net
debt should not, however, be considered in isolation or as an
alternative to short-term debt and long-term debt as presented
in accordance with IFRS. For further information about the
usefulness and limitations of Net debt, see C. NOTES AND
FORWARD-LOOKING STATEMENTS.
(in millions of €)
September ,
Short-term debt and current maturities
of long-term debt 1,944 3,826
Long-term debt 18,509 16,880
Total debt 20,453 20,707
Cash and cash equivalents (9,190) (10,891)
Available-for-sale financial assets (current) (601) (524)
Total liquidity (9,790) (11,415)
Net debt 10,663 9,292
1 We typically need a considerable portion of our cash and cash equivalents as well
as current available-for-sale financial assets at any given time for purposes other
than debt reduction. The deduction of these items from total debt in the calculation
of Net debt therefore should not be understood to mean that these items are
available exclusively for debt reduction at any given time. Net debt comprises
items as stated on D. CONSOLIDATED STATEMENTS OF FINANCIAL POSITION.
The changes in Net debt from fiscal to may also be
presented as follows:
Changes in Net debt (in millions of €)
1 In fiscal , cash outflows for the build-up of operating
net working capital included cash outflows for inventories
less advance payments received of € million, for trade
and other receivables of € million, for trade payables
of €217 million and for billings in excess of costs and
estimated earnings on uncompleted contracts and related
advances of €1,060 million.
2 Continuing operations.
3 Included cash flows relating to certain financing activities
such as dividends paid and purchase of treasury shares
as well as effects without cash flow impact such as effects
of exchange rates and fair value hedge accounting
adjustments.
9,292 1,787 (8,914) 4,836 3,186 476 10,663
Net debt as of
September ,
Cash outflows for the
build-up of operating
net working capital
Income and other
changes in cash
flows from
operating activities
Cash flows from
investing activities
Changes in certain
financing activities
Effect of deconsolidati-
on of OSRAM on cash
and cash equivalents
Net debt as of
September ,
Total cash flows from operating activities