Siemens 2013 Annual Report Download - page 197
Download and view the complete annual report
Please find page 197 of the 2013 Siemens annual report below. You can navigate through the pages in the report by either clicking on the pages listed below, or by using the keyword search tool below to find specific information within the annual report.-
 1
1 -
2
-
3
-
4
-
5
-
6
-
7
-
8
-
9
-
10
-
11
-
12
-
13
-
14
-
15
-
16
-
17
-
18
-
19
-
20
-
21
-
22
-
23
-
24
-
25
-
26
-
27
-
28
-
29
-
30
-
31
-
32
-
33
-
34
-
35
-
36
-
37
-
38
-
39
-
40
-
41
-
42
-
43
-
44
-
45
-
46
-
47
-
48
-
49
-
50
-
51
-
52
-
53
-
54
-
55
-
56
-
57
-
58
-
59
-
60
-
61
-
62
-
63
-
64
-
65
-
66
-
67
-
68
-
69
-
70
-
71
-
72
-
73
-
74
-
75
-
76
-
77
-
78
-
79
-
80
-
81
-
82
-
83
-
84
-
85
-
86
-
87
-
88
-
89
-
90
-
91
-
92
-
93
-
94
-
95
-
96
-
97
-
98
-
99
-
100
-
101
-
102
-
103
-
104
-
105
-
106
-
107
-
108
-
109
-
110
-
111
-
112
-
113
-
114
-
115
-
116
-
117
-
118
-
119
-
120
-
121
-
122
-
123
-
124
-
125
-
126
-
127
-
128
-
129
-
130
-
131
-
132
-
133
-
134
-
135
-
136
-
137
-
138
-
139
-
140
-
141
-
142
-
143
-
144
-
145
-
146
-
147
-
148
-
149
-
150
-
151
-
152
-
153
-
154
-
155
-
156
-
157
-
158
-
159
-
160
-
161
-
162
-
163
-
164
-
165
-
166
-
167
-
168
-
169
-
170
-
171
-
172
-
173
-
174
-
175
-
176
-
177
-
178
-
179
-
180
-
181
-
182
-
183
-
184
-
185
-
186
-
 187
187 -
 188
188 -
 189
189 -
 190
190 -
 191
191 -
 192
192 -
 193
193 -
 194
194 -
 195
195 -
 196
196 -
 197
197 -
 198
198 -
 199
199 -
 200
200 -
 201
201 -
 202
202 -
 203
203 -
 204
204 -
 205
205 -
 206
206 -
 207
207 -
208
-
209
-
210
-
211
-
212
-
213
-
214
-
215
-
216
-
217
-
218
-
219
-
220
-
221
-
222
-
223
-
224
-
225
-
226
-
227
-
228
-
229
-
230
-
231
-
232
-
233
-
234
-
235
-
236
-
237
-
238
-
239
-
240
-
241
-
242
-
243
-
244
-
245
-
246
-
247
-
248
-
249
-
250
-
251
-
252
-
253
-
254
-
255
-
256
-
257
-
258
-
259
-
260
-
261
-
262
-
263
-
264
-
265
-
266
-
267
-
268
-
269
-
270
-
271
-
272
-
273
-
274
-
275
-
276
-
277
-
278
-
279
-
280
-
281
-
282
-
283
-
284
-
285
-
286
-
287
-
288
-
289
-
290
-
291
-
292
-
293
-
294
-
295
-
296
-
297
-
298
-
299
-
300
-
301
-
302
-
303
-
304
-
305
-
306
-
307
-
308
-
309
-
310
-
311
-
312
-
313
-
314
-
315
-
316
-
317
-
318
-
319
-
320
-
321
-
322
-
323
-
324
-
325
-
326
-
327
-
328
-
329
-
330
-
331
-
332
-
333
-
334
-
335
-
336
-
337
-
338
-
339
-
340
-
341
-
342
-
343
-
344
-
345
-
346
-
347
-
348
-
349
-
350
-
351
-
352
-
353
-
354
-
355
-
356
-
357
-
358
-
359
-
360
-
361
-
362
-
363
-
364
-
365
-
366
-
367
-
368
-
369
-
370
-
371
-
372
 |
 |

253 D. Consolidated Financial Statements
357 E. Additional Information
245 C. Compensation Report, Corporate Governance
statement pursuant to Section a of the
German Commercial Code, Takeover-relevant
information and explanatory report
246 C. Siemens AG ( Discussion on basis of
German Commercial Code)
250 C. Notes and forward-looking statements
Discontinued operations provided cash of € million in fiscal
, compared to cash inflows of € million in the prior
year. In both periods cash inflows related primarily to OSRAM.
Cash flows from investing activities – Cash used in investing
activities for continuing operations amounted to €. billion
in fiscal , compared to cash used of €. billion in the
prior-year period. Acquisitions of businesses, net of cash ac-
quired, totaled €. billion in the current period, including a
preliminary purchase price payment (excluding cash acquired)
of €. billion for Infrastructure & Cities’ acquisition of Inven-
sys Rail and € million for Industry ’s acquisition of LMS In-
ternational NV. SFS continued to successfully execute its asset
growth strategy, and cash outflows for the change in receiv-
ables from financing activities amounted to €. billion and
€. billion, in fiscal and , respectively. The prior
year included acquisitions of businesses, net of cash acquired,
totaling €. billion, including among others the acquisition
of the Connectors and Measurements Division of Expro Hold-
ings UK Ltd. In fiscal cash inflows of €. billion for
the disposal of investments, intangibles and property, plant
and equipment included proceeds of €. billion relating to the
sale of our % stake in NSN and €. billion relating to the
sale of our AtoS convertible bonds. For comparison, cash in-
flows of € million in the prior year included proceeds from
the sale of our interest in OAO Power Machines. Due to tight
control of capital expenditures particularly within the Sectors,
additions to intangible assets and property, plant and equip-
ment from continuing operations decreased from €. bil-
lion in the prior year to €. billion in fiscal .
Discontinued operations used cash of € million in fiscal
, compared to cash used of € million in the prior year,
when cash outflows related to Siemens IT Solutions and Ser-
vices included payments of a mid triple-digit million euro
amount.
Free cash flow from continuing operations increased to €.
billion in fiscal from €. billion a year earlier, reflecting
a higher conversion of income into cash year-over-year. The in-
crease of Free cash flow year-over-year was due to higher cash
inflows from operating activities and lower additions to intan-
gible assets and property, plant and equipment as discussed
above.
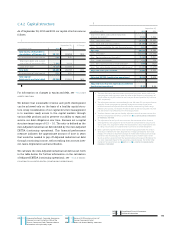
On a sequential basis Free cash flow during fiscal and
fiscal developed as follows:
Cash flows from financing activities – Continuing opera-
tions used cash for financing activities of €. billion in fis-
cal , compared to cash used of €. billion in the same
period a year earlier. As described in C... DEBT AND CREDIT
FACILITIES, the current period included proceeds from the issu-
ance of long-term debt of €. billion related to the bonds
issued and term loans taken.
These cash inflows were more
than offset by the repayment of long-term debt of €. billion
related mainly to the redemption of €. billion fixed-rate-in-
struments and a US$. billion floating-rate term loan and by
the cash outflows for the purchase of treasury shares totaling
€. billion. The purchase of treasury shares was made pri-
marily under Siemens’ share buyback program, which was
completed in November . For comparison, prior-year pro-
ceeds from the issuance of long-term debt were €. billion,
including the issuance of US$. billion bonds with warrant
units as well as the issuance of €. billion and £. billion in
fixed-rate instruments in four tranches. These cash inflows
were largely offset by the repayment of long-term debt of
€. billion in the prior year for the redemption of €. bil-
lion in .% fixed rate instruments, €. billion in floating rate
assignable loans, US$. billion in floating rate notes and
US$. billion in .% notes and by the cash outflows for the
purchase of treasury shares totaling €. billion. Both peri-
ods included cash outflows for dividends paid to shareholders
of Siemens AG, which were €. billion (for fiscal ) in
fiscal compared to €. billion in fiscal (for fiscal
). In fiscal we recorded cash inflows of € million
for financing of discontinued operations, compared to cash
outflows of € million a year earlier. Discontinued opera-
tions are financed generally from Corporate Treasury. How-
ever, fiscal included an external term loan in the amount
of € million, which was drawn by OSRAM near the effective
date of its spin-off.
Free cash flow (in millions of €)
Q4 2013 4,357
Q3 2013 956
Q2 2013 1,360
Q1 2013 (1,416)
Q4 2012 4,328
Q3 2012 870
Q2 2012 534
Q1 2012 (1,004)
1 Continuing operations.