Siemens 2013 Annual Report Download - page 304
Download and view the complete annual report
Please find page 304 of the 2013 Siemens annual report below. You can navigate through the pages in the report by either clicking on the pages listed below, or by using the keyword search tool below to find specific information within the annual report.-
 1
1 -
2
-
3
-
4
-
5
-
6
-
7
-
8
-
9
-
10
-
11
-
12
-
13
-
14
-
15
-
16
-
17
-
18
-
19
-
20
-
21
-
22
-
23
-
24
-
25
-
26
-
27
-
28
-
29
-
30
-
31
-
32
-
33
-
34
-
35
-
36
-
37
-
38
-
39
-
40
-
41
-
42
-
43
-
44
-
45
-
46
-
47
-
48
-
49
-
50
-
51
-
52
-
53
-
54
-
55
-
56
-
57
-
58
-
59
-
60
-
61
-
62
-
63
-
64
-
65
-
66
-
67
-
68
-
69
-
70
-
71
-
72
-
73
-
74
-
75
-
76
-
77
-
78
-
79
-
80
-
81
-
82
-
83
-
84
-
85
-
86
-
87
-
88
-
89
-
90
-
91
-
92
-
93
-
94
-
95
-
96
-
97
-
98
-
99
-
100
-
101
-
102
-
103
-
104
-
105
-
106
-
107
-
108
-
109
-
110
-
111
-
112
-
113
-
114
-
115
-
116
-
117
-
118
-
119
-
120
-
121
-
122
-
123
-
124
-
125
-
126
-
127
-
128
-
129
-
130
-
131
-
132
-
133
-
134
-
135
-
136
-
137
-
138
-
139
-
140
-
141
-
142
-
143
-
144
-
145
-
146
-
147
-
148
-
149
-
150
-
151
-
152
-
153
-
154
-
155
-
156
-
157
-
158
-
159
-
160
-
161
-
162
-
163
-
164
-
165
-
166
-
167
-
168
-
169
-
170
-
171
-
172
-
173
-
174
-
175
-
176
-
177
-
178
-
179
-
180
-
181
-
182
-
183
-
184
-
185
-
186
-
187
-
188
-
189
-
190
-
191
-
192
-
193
-
194
-
195
-
196
-
197
-
198
-
199
-
200
-
201
-
202
-
203
-
204
-
205
-
206
-
207
-
208
-
209
-
210
-
211
-
212
-
213
-
214
-
215
-
216
-
217
-
218
-
219
-
220
-
221
-
222
-
223
-
224
-
225
-
226
-
227
-
228
-
229
-
230
-
231
-
232
-
233
-
234
-
235
-
236
-
237
-
238
-
239
-
240
-
241
-
242
-
243
-
244
-
245
-
246
-
247
-
248
-
249
-
250
-
251
-
252
-
253
-
254
-
255
-
256
-
257
-
258
-
259
-
260
-
261
-
262
-
263
-
264
-
265
-
266
-
267
-
268
-
269
-
270
-
271
-
272
-
273
-
274
-
275
-
276
-
277
-
278
-
279
-
280
-
281
-
282
-
283
-
284
-
285
-
286
-
287
-
288
-
289
-
290
-
291
-
292
-
293
-
 294
294 -
 295
295 -
 296
296 -
 297
297 -
 298
298 -
 299
299 -
 300
300 -
 301
301 -
 302
302 -
 303
303 -
 304
304 -
 305
305 -
 306
306 -
 307
307 -
 308
308 -
 309
309 -
 310
310 -
 311
311 -
 312
312 -
 313
313 -
 314
314 -
315
-
316
-
317
-
318
-
319
-
320
-
321
-
322
-
323
-
324
-
325
-
326
-
327
-
328
-
329
-
330
-
331
-
332
-
333
-
334
-
335
-
336
-
337
-
338
-
339
-
340
-
341
-
342
-
343
-
344
-
345
-
346
-
347
-
348
-
349
-
350
-
351
-
352
-
353
-
354
-
355
-
356
-
357
-
358
-
359
-
360
-
361
-
362
-
363
-
364
-
365
-
366
-
367
-
368
-
369
-
370
-
371
-
372
 |
 |

92 A. To our Shareholders 117 B. Corporate Governance 155 C. Combined Management Report
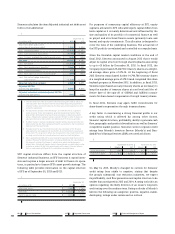
Siemens calculates the item Adjusted industrial net debt as set
forth in the table below:
(in millions of €)
September 30,
2013 2012
Short-term debt and current
maturities of long-term debt
1,944 3,826
Plus: Long-term debt
18,509 16,880
Less: Cash and cash equivalents (9,190) (10,891)
Less: Current available-for-sale financial assets (601) (524)
Net debt 10,663 9,292
Less: SFS Debt (15,600) (14,558)
Plus: Post-employment benefits
9,265 9,801
Plus: Credit guarantees 622 326
Less: 50% nominal amount hybrid bond (899) (920)
Less: Fair value hedge accounting
adjustment (1,247) (1,670)
Adjusted industrial net debt 2,805 2,271
Adjusted EBITDA
(continuing operations) 8,215 9,613
Adjusted industrial net debt/adjusted EBITDA
(continuing operations) 0.34 0.24
1 The item Short-term debt and current maturities of long-term debt as well as the
item Long-term debt included in total fair value hedge accounting adjustments
of €1,247 million and €1,670 million for the fiscal year ended September 30, 2013
and 2012, respectively.
2 The adjustment considers that both Moody ’s and S&P view SFS as a captive fi-
nance company. These rating agencies generally recognize and accept higher
levels of debt attributable to captive finance subsidiaries in determining credit
ratings. Following this concept, Siemens excludes SFS Debt in order to derive an
adjusted industrial net debt which is not affected by SFS’s financing activities.
3 To reflect Siemens’ total post-employment benefit liability, adjusted industrial net
debt includes line item Post-employment benefits as presented in the Consolidated
Statements of Financial Position.
4 The adjustment for our hybrid bond considers the calculation of this financial
ratio applied by rating agencies to classify 50% of our hybrid bond as equity and
50% as debt. This assignment reflects the characteristics of our hybrid bond such
as a long maturity date and subordination to all senior and debt obligations.
5 Debt is generally reported with a value representing approximately the amount to
be repaid. However for debt designated in a hedging relationship (fair value hedges),
this amount is adjusted by changes in market value mainly due to changes in
interest rates. Accordingly Siemens deducts these changes in market value in order
to derive an amount of debt that approximately will be repaid. Siemens believes
this is a more meaningful figure for the calculation presented above.
SFS’ capital structure differs from the capital structure of
Siemens’ industrial business, as SFS’ business is capital inten-
sive and requires a larger amount of debt to finance its opera-
tions, in particular to finance SFS’s asset growth strategy. The
following table provides information on the capital structure
of SFS as of September , and :
September 30,
(in millions of €) 2013 2012
Allocated equity 1,938 1,790
SFS Debt 15,600 14,558
Debt to equity ratio 8.05 8.13
For purposes of measuring capital efficiency at SFS, equity
capital is allocated to SFS. Allocated equity capital differs from
book capital as it is mainly determined and influenced by the
size and quality of its portfolio of commercial finance as well
as project and structured finance assets (primarily loans and
leases) and equity investments. This allocation is designed to
cover the risks of the underlying business. The actual risk of
the SFS portfolio is evaluated and controlled on a regular basis.
Given the favorable capital market conditions at the end of
fiscal , Siemens announced in August that it would
adjust its capital structure through share buybacks amounting
to up to € billion by December , . In fiscal , the
Company repurchased ,, treasury shares at a weight-
ed average share price of €.. At the beginning of fiscal
Siemens repurchased further ,, treasury shares
at a weighted average price of €. and completed this share
buyback program in November . In addition, in fiscal ,
Siemens repurchased as many treasury shares as necessary to
keep the number of treasury shares at a set level until the ef-
fective date of the spin-off of OSRAM and fulfilled commit-
ments for share-based compensation through treasury shares.
In fiscal , Siemens may again fulfill commitments for
share-based compensation through treasury shares.
A key factor in maintaining a strong financial profile is our
credit rating which is affected by, among other factors,
Siemens’ capital structure, profitability, ability to generate cash
flow, geographic and product diversification as well as Siemens’
competitive market position. Siemens’ current corporate credit
ratings from Moody ’s Investors Service (Moody ’s) and Stan-
dard & Poor’s Ratings Services (S&P) are noted as follows:
September 30, 2013 September 30, 2012
Moody ’s S&P Moody ’s S&P
Long-term debt Aa3 A+ Aa3 A+
Short-term debt P -1 A -1+ P -1 A -1+
On May , , Moody ’s changed its outlook for Siemens’
credit rating from stable to negative, stating that despite
the group’s substantial cost reduction initiatives, we expect
its profitability, cash flow generation and capital structure to be
weaker than anticipated in and . A rating outlook is an
opinion regarding the likely direction of an issuer’s long-term
credit rating over the medium-term. Rating out looks of Moody ’s
fall into the following six categories: positive, negative, stable,
developing, ratings under review and no outlook.