Siemens 2013 Annual Report Download - page 168
Download and view the complete annual report
Please find page 168 of the 2013 Siemens annual report below. You can navigate through the pages in the report by either clicking on the pages listed below, or by using the keyword search tool below to find specific information within the annual report.-
 1
1 -
2
-
3
-
4
-
5
-
6
-
7
-
8
-
9
-
10
-
11
-
12
-
13
-
14
-
15
-
16
-
17
-
18
-
19
-
20
-
21
-
22
-
23
-
24
-
25
-
26
-
27
-
28
-
29
-
30
-
31
-
32
-
33
-
34
-
35
-
36
-
37
-
38
-
39
-
40
-
41
-
42
-
43
-
44
-
45
-
46
-
47
-
48
-
49
-
50
-
51
-
52
-
53
-
54
-
55
-
56
-
57
-
58
-
59
-
60
-
61
-
62
-
63
-
64
-
65
-
66
-
67
-
68
-
69
-
70
-
71
-
72
-
73
-
74
-
75
-
76
-
77
-
78
-
79
-
80
-
81
-
82
-
83
-
84
-
85
-
86
-
87
-
88
-
89
-
90
-
91
-
92
-
93
-
94
-
95
-
96
-
97
-
98
-
99
-
100
-
101
-
102
-
103
-
104
-
105
-
106
-
107
-
108
-
109
-
110
-
111
-
112
-
113
-
114
-
115
-
116
-
117
-
118
-
119
-
120
-
121
-
122
-
123
-
124
-
125
-
126
-
127
-
128
-
129
-
130
-
131
-
132
-
133
-
134
-
135
-
136
-
137
-
138
-
139
-
140
-
141
-
142
-
143
-
144
-
145
-
146
-
147
-
148
-
149
-
150
-
151
-
152
-
153
-
154
-
155
-
156
-
157
-
 158
158 -
 159
159 -
 160
160 -
 161
161 -
 162
162 -
 163
163 -
 164
164 -
 165
165 -
 166
166 -
 167
167 -
 168
168 -
 169
169 -
 170
170 -
 171
171 -
 172
172 -
 173
173 -
 174
174 -
 175
175 -
 176
176 -
 177
177 -
 178
178 -
179
-
180
-
181
-
182
-
183
-
184
-
185
-
186
-
187
-
188
-
189
-
190
-
191
-
192
-
193
-
194
-
195
-
196
-
197
-
198
-
199
-
200
-
201
-
202
-
203
-
204
-
205
-
206
-
207
-
208
-
209
-
210
-
211
-
212
-
213
-
214
-
215
-
216
-
217
-
218
-
219
-
220
-
221
-
222
-
223
-
224
-
225
-
226
-
227
-
228
-
229
-
230
-
231
-
232
-
233
-
234
-
235
-
236
-
237
-
238
-
239
-
240
-
241
-
242
-
243
-
244
-
245
-
246
-
247
-
248
-
249
-
250
-
251
-
252
-
253
-
254
-
255
-
256
-
257
-
258
-
259
-
260
-
261
-
262
-
263
-
264
-
265
-
266
-
267
-
268
-
269
-
270
-
271
-
272
-
273
-
274
-
275
-
276
-
277
-
278
-
279
-
280
-
281
-
282
-
283
-
284
-
285
-
286
-
287
-
288
-
289
-
290
-
291
-
292
-
293
-
294
-
295
-
296
-
297
-
298
-
299
-
300
-
301
-
302
-
303
-
304
-
305
-
306
-
307
-
308
-
309
-
310
-
311
-
312
-
313
-
314
-
315
-
316
-
317
-
318
-
319
-
320
-
321
-
322
-
323
-
324
-
325
-
326
-
327
-
328
-
329
-
330
-
331
-
332
-
333
-
334
-
335
-
336
-
337
-
338
-
339
-
340
-
341
-
342
-
343
-
344
-
345
-
346
-
347
-
348
-
349
-
350
-
351
-
352
-
353
-
354
-
355
-
356
-
357
-
358
-
359
-
360
-
361
-
362
-
363
-
364
-
365
-
366
-
367
-
368
-
369
-
370
-
371
-
372
 |
 |

92 A. To our Shareholders
117 B. Corporate Governance 155 C. Combined Management Report
156 C. Business and economic environment
173 C. Financial performance system
179 C. Results of operations
192 C. Financial position
204 C. Net assets position
207 C. Overall assessment of the economic position
209 C. Subsequent events
210 C. Sustainability
227 C. Report on expected developments and
associated material opportunities and risks
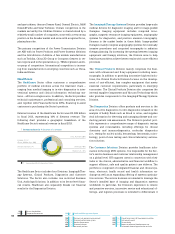
Development of raw material prices (Index: Beginning of fiscal = )
FY FY FY FY FY
Copper Aluminum (HG) Steel HRC
Source: London Metal Exchange (LME) for copper and aluminum, CRU HRC Germany for steel; cash prices in € per ton.
Average monthly prices of aluminum traded at the London
Metal Exchange were % lower in September as com-
pared to September . Prices on a fiscal-year average were
% lower in fiscal than the average for fiscal . Higher
premiums for physically delivered aluminum offset the erosion
of exchange prices to some extent. Besides that, the alumi-
num industry is suffering from oversupply due to a combina-
tion of weaker investment sentiment among customers and
rapid expansion of production capacities by manufacturers. As
with copper, we see developments in the aluminum market as
posing a price risk, rather than a supply risk.
The average monthly steel prices for September declined
by % compared to the average monthly prices in September
. Prices on a fiscal-year average were % lower in fiscal
than the average for fiscal (source: CRU, an indepen-
dent business analysis and consultancy group focused on,
among other things, the mining and metals sectors).
Our main exposure to the prices of copper and related prod-
ucts, and to carbon steel and stainless steel, is in the Sectors
Energy, Industry and Infrastructure & Cities. Our main price ex-
posure related to aluminum is in the Energy Sector. In addi-
tion, Siemens is generally exposed to energy and fuel prices,
both directly (electricity, gas, oil) and indirectly (energy used
in the manufacturing processes of suppliers, fuels included in
logistics costs).
Siemens employs various strategies to reduce the price risk in
its project and product businesses, such as long-term contract-
ing with suppliers, physical and financial hedging and price
escalation clauses with customers.
C... MARKET DEVELOPMENT
Overall, markets served by our Energy Sector grew moderately
in fiscal compared to fiscal , with all of the Sector’s
businesses except for solar power benefiting from improved
market conditions year-over-year. In particular, the markets for
fossil power, wind power and power transmission recovered
from market declines in fiscal and returned to the levels
reached in fiscal .
Growth for the markets served by our Fossil Power Genera-
tion Division benefited from a shift towards larger, more effi-
cient units with higher power output. Globally, customers in
emerging markets mainly added new capacities while custom-
ers in advanced economies mainly replaced existing power
plants that are now considered relatively inefficient and inflex-
ible. Despite the overall growth of fossil markets, the market
for advanced gas power plants remained approximately at the
same level as in fiscal . Demand in Europe was held back
by an ongoing slow economic development and uncertainties
in regulatory frameworks. Political instability impacted market
development in the Middle East despite social and economic
pressure to add capacity. Within the Americas region, the U.S.