Siemens 2013 Annual Report Download - page 186
Download and view the complete annual report
Please find page 186 of the 2013 Siemens annual report below. You can navigate through the pages in the report by either clicking on the pages listed below, or by using the keyword search tool below to find specific information within the annual report.-
 1
1 -
2
-
3
-
4
-
5
-
6
-
7
-
8
-
9
-
10
-
11
-
12
-
13
-
14
-
15
-
16
-
17
-
18
-
19
-
20
-
21
-
22
-
23
-
24
-
25
-
26
-
27
-
28
-
29
-
30
-
31
-
32
-
33
-
34
-
35
-
36
-
37
-
38
-
39
-
40
-
41
-
42
-
43
-
44
-
45
-
46
-
47
-
48
-
49
-
50
-
51
-
52
-
53
-
54
-
55
-
56
-
57
-
58
-
59
-
60
-
61
-
62
-
63
-
64
-
65
-
66
-
67
-
68
-
69
-
70
-
71
-
72
-
73
-
74
-
75
-
76
-
77
-
78
-
79
-
80
-
81
-
82
-
83
-
84
-
85
-
86
-
87
-
88
-
89
-
90
-
91
-
92
-
93
-
94
-
95
-
96
-
97
-
98
-
99
-
100
-
101
-
102
-
103
-
104
-
105
-
106
-
107
-
108
-
109
-
110
-
111
-
112
-
113
-
114
-
115
-
116
-
117
-
118
-
119
-
120
-
121
-
122
-
123
-
124
-
125
-
126
-
127
-
128
-
129
-
130
-
131
-
132
-
133
-
134
-
135
-
136
-
137
-
138
-
139
-
140
-
141
-
142
-
143
-
144
-
145
-
146
-
147
-
148
-
149
-
150
-
151
-
152
-
153
-
154
-
155
-
156
-
157
-
158
-
159
-
160
-
161
-
162
-
163
-
164
-
165
-
166
-
167
-
168
-
169
-
170
-
171
-
172
-
173
-
174
-
175
-
 176
176 -
 177
177 -
 178
178 -
 179
179 -
 180
180 -
 181
181 -
 182
182 -
 183
183 -
 184
184 -
 185
185 -
 186
186 -
 187
187 -
 188
188 -
 189
189 -
 190
190 -
 191
191 -
 192
192 -
 193
193 -
 194
194 -
 195
195 -
 196
196 -
197
-
198
-
199
-
200
-
201
-
202
-
203
-
204
-
205
-
206
-
207
-
208
-
209
-
210
-
211
-
212
-
213
-
214
-
215
-
216
-
217
-
218
-
219
-
220
-
221
-
222
-
223
-
224
-
225
-
226
-
227
-
228
-
229
-
230
-
231
-
232
-
233
-
234
-
235
-
236
-
237
-
238
-
239
-
240
-
241
-
242
-
243
-
244
-
245
-
246
-
247
-
248
-
249
-
250
-
251
-
252
-
253
-
254
-
255
-
256
-
257
-
258
-
259
-
260
-
261
-
262
-
263
-
264
-
265
-
266
-
267
-
268
-
269
-
270
-
271
-
272
-
273
-
274
-
275
-
276
-
277
-
278
-
279
-
280
-
281
-
282
-
283
-
284
-
285
-
286
-
287
-
288
-
289
-
290
-
291
-
292
-
293
-
294
-
295
-
296
-
297
-
298
-
299
-
300
-
301
-
302
-
303
-
304
-
305
-
306
-
307
-
308
-
309
-
310
-
311
-
312
-
313
-
314
-
315
-
316
-
317
-
318
-
319
-
320
-
321
-
322
-
323
-
324
-
325
-
326
-
327
-
328
-
329
-
330
-
331
-
332
-
333
-
334
-
335
-
336
-
337
-
338
-
339
-
340
-
341
-
342
-
343
-
344
-
345
-
346
-
347
-
348
-
349
-
350
-
351
-
352
-
353
-
354
-
355
-
356
-
357
-
358
-
359
-
360
-
361
-
362
-
363
-
364
-
365
-
366
-
367
-
368
-
369
-
370
-
371
-
372
 |
 |

92 A. To our Shareholders
117 B. Corporate Governance 155 C. Combined Management Report
156 C. Business and economic environment
173 C. Financial performance system
179 C. Results of operations
192 C. Financial position
204 C. Net assets position
207 C. Overall assessment of the economic position
209 C. Subsequent events
210 C. Sustainability
227 C. Report on expected developments and
associated material opportunities and risks
C... INDUSTRY
Sector
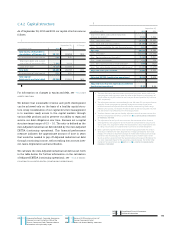
Year ended September , % Change therein
(in millions of €) Actual Adjusted Currency Portfolio
Profit 1,478 2,448 (40)%
Profit margin 8.0% 12.6%
Orders 18,417 18,962 (3)% (3)% (1)% 1%
Total revenue 18,586 19,409 (4)% (4)% (1)% 1%
External revenue 16,943 17,772 (5)%
therein:
Europe, C.I.S., Africa, Middle East 9,261 9,644 (4)%
therein Germany 4,198 4,464 (6)%
Americas 3,290 3,484 (6)%
Asia, Australia 4,393 4,644 (5)%
1 Excluding currency translation and portfolio effects. 2 Commonwealth of Independent States.
In fiscal , profit at Industry fell sharply to €. billion,
impacted by € million in charges for the “Siemens ”
program primarily for improving the Sector’s global footprint
and reducing costs associated with administrative processes.
Profit development was held back also by lower revenue and a
less favorable business mix, due mainly to continuing softness
in the Sector’s short-cycle businesses. In addition, the Sector
took € million in charges for two large projects at its metals
technologies business.
The market environment for Industry through most of fiscal
was clearly more challenging than a year earlier. Despite
signs of stabilizing towards the end of the period, revenue de-
clined moderately year-over-year on broad-based decreases at
both Divisions and the metals technologies business. Orders
for the Sector declined % year-over-year, as reported growth
on larger orders at the end of the year was more than offset by
a low order intake through most of fiscal .
On a geographic basis, Industry ’s orders and revenue both
showed a broad-based decline in all three reporting regions.
The book-to-bill ratio was ., and Industry ’s order backlog
declined to € billion at the end of fiscal .
Orders by Business
Year ended September , % Change therein
(in millions of €) Actual Adjusted Currency Portfolio
Industry Automation 8,143 8,524 (4)% (5)% (1)% 2%
Drive Technologies 9,024 9,395 (4)% (3)% (1)% 0%
1 Excluding currency translation and portfolio effects.
Revenue by Business
Year ended September , % Change therein
(in millions of €) Actual Adjusted Currency Portfolio
Industry Automation 8,194 8,463 (3)% (3)% (1)% 1%
Drive Technologies 9,208 9,640 (4)% (4)% (1)% 0%
1 Excluding currency translation and portfolio effects.