Siemens 2013 Annual Report Download - page 160
Download and view the complete annual report
Please find page 160 of the 2013 Siemens annual report below. You can navigate through the pages in the report by either clicking on the pages listed below, or by using the keyword search tool below to find specific information within the annual report.-
 1
1 -
2
-
3
-
4
-
5
-
6
-
7
-
8
-
9
-
10
-
11
-
12
-
13
-
14
-
15
-
16
-
17
-
18
-
19
-
20
-
21
-
22
-
23
-
24
-
25
-
26
-
27
-
28
-
29
-
30
-
31
-
32
-
33
-
34
-
35
-
36
-
37
-
38
-
39
-
40
-
41
-
42
-
43
-
44
-
45
-
46
-
47
-
48
-
49
-
50
-
51
-
52
-
53
-
54
-
55
-
56
-
57
-
58
-
59
-
60
-
61
-
62
-
63
-
64
-
65
-
66
-
67
-
68
-
69
-
70
-
71
-
72
-
73
-
74
-
75
-
76
-
77
-
78
-
79
-
80
-
81
-
82
-
83
-
84
-
85
-
86
-
87
-
88
-
89
-
90
-
91
-
92
-
93
-
94
-
95
-
96
-
97
-
98
-
99
-
100
-
101
-
102
-
103
-
104
-
105
-
106
-
107
-
108
-
109
-
110
-
111
-
112
-
113
-
114
-
115
-
116
-
117
-
118
-
119
-
120
-
121
-
122
-
123
-
124
-
125
-
126
-
127
-
128
-
129
-
130
-
131
-
132
-
133
-
134
-
135
-
136
-
137
-
138
-
139
-
140
-
141
-
142
-
143
-
144
-
145
-
146
-
147
-
148
-
149
-
 150
150 -
 151
151 -
 152
152 -
 153
153 -
 154
154 -
 155
155 -
 156
156 -
 157
157 -
 158
158 -
 159
159 -
 160
160 -
 161
161 -
 162
162 -
 163
163 -
 164
164 -
 165
165 -
 166
166 -
 167
167 -
 168
168 -
 169
169 -
 170
170 -
171
-
172
-
173
-
174
-
175
-
176
-
177
-
178
-
179
-
180
-
181
-
182
-
183
-
184
-
185
-
186
-
187
-
188
-
189
-
190
-
191
-
192
-
193
-
194
-
195
-
196
-
197
-
198
-
199
-
200
-
201
-
202
-
203
-
204
-
205
-
206
-
207
-
208
-
209
-
210
-
211
-
212
-
213
-
214
-
215
-
216
-
217
-
218
-
219
-
220
-
221
-
222
-
223
-
224
-
225
-
226
-
227
-
228
-
229
-
230
-
231
-
232
-
233
-
234
-
235
-
236
-
237
-
238
-
239
-
240
-
241
-
242
-
243
-
244
-
245
-
246
-
247
-
248
-
249
-
250
-
251
-
252
-
253
-
254
-
255
-
256
-
257
-
258
-
259
-
260
-
261
-
262
-
263
-
264
-
265
-
266
-
267
-
268
-
269
-
270
-
271
-
272
-
273
-
274
-
275
-
276
-
277
-
278
-
279
-
280
-
281
-
282
-
283
-
284
-
285
-
286
-
287
-
288
-
289
-
290
-
291
-
292
-
293
-
294
-
295
-
296
-
297
-
298
-
299
-
300
-
301
-
302
-
303
-
304
-
305
-
306
-
307
-
308
-
309
-
310
-
311
-
312
-
313
-
314
-
315
-
316
-
317
-
318
-
319
-
320
-
321
-
322
-
323
-
324
-
325
-
326
-
327
-
328
-
329
-
330
-
331
-
332
-
333
-
334
-
335
-
336
-
337
-
338
-
339
-
340
-
341
-
342
-
343
-
344
-
345
-
346
-
347
-
348
-
349
-
350
-
351
-
352
-
353
-
354
-
355
-
356
-
357
-
358
-
359
-
360
-
361
-
362
-
363
-
364
-
365
-
366
-
367
-
368
-
369
-
370
-
371
-
372
 |
 |

92 A. To our Shareholders
117 B. Corporate Governance 155 C. Combined Management Report
156 C. Business and economic environment
173 C. Financial performance system
179 C. Results of operations
192 C. Financial position
204 C. Net assets position
207 C. Overall assessment of the economic position
209 C. Subsequent events
210 C. Sustainability
227 C. Report on expected developments and
associated material opportunities and risks
and gas turbines, they are Dresser Rand, General Electric, MAN
Diesel & Turbo and Solar Turbines. Overall, competition in the
markets served by the Oil & Gas Division is characterized by a
relatively small number of companies, some with a very strong
position in the broader market and some with a regional focus,
playing key roles.
The primary competitors of the Power Transmission Division
are ABB with its Power Products and Power Systems divisions
and the Grid division of Alstom. A few notable manufacturers
such as Toshiba, China XD Group or Crompton Greaves in cer-
tain regions and niche specialists (e.g., TBEA) represent anoth-
er group of competitors. International competition is increas-
ing from manufacturers in emerging countries such as China,
India and Korea.
Healthcare
The Healthcare Sector offers customers a comprehensive
portfolio of medical solutions across the treatment chain –
ranging from medical imaging to in-vitro diagnostics to inter-
ventional systems and clinical information technology sys-
tems – all from a single source. In addition, the Sector provides
technical maintenance, professional and consulting services,
and, together with Financial Services (SFS), financing to assist
customers in purchasing the Sector’s products.
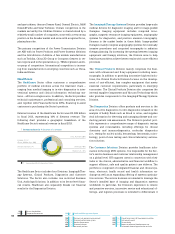
External revenue of the Healthcare Sector was €. billion
in fiscal , representing % of Siemens revenue. The
following chart provides a geographic breakdown of the
Healthcare Sector’s external revenue in fiscal .
The Healthcare Sector includes four Divisions: Imaging & Ther-
apy Systems, Clinical Products, Diagnostics and Customer
Solutions. The Sector also includes one sector-led Business
Unit, Audiology Solutions. In addition to its Sector-level finan-
cial results, Healthcare also separately breaks out financial
results for the Diagnostics Division.
The Imaging & Therapy Systems Division provides large-scale
medical devices for diagnostic imaging and for image-guided
therapies. Imaging equipment includes computed tomo-
graphs, magnetic resonance imaging equipment, angiography
systems for diagnostics, and positron emission tomography.
Siemens is the market leader in these fields. Image-guided
therapies mainly comprise angiography systems for minimally
invasive procedures and computed tomographs in radiation
therapy planning. By increasing the synergy between imaging
equipment and therapy solutions, the Division aims to help
healthcare providers achieve better results with more efficient
processes.
The Clinical Products Division mainly comprises the busi-
ness with ultrasound and X-ray equipment including mam-
mography. In addition to providing innovative high-end solu-
tions, the Clinical Products Division focuses on the develop-
ment of cost-efficient, less complex equipment that meets
essential customer requirements, particularly in emerging
economies. The Clinical Products Division also comprises the
internal supplier Components and Vacuum Technology which
also provides components to the Imaging & Therapy Systems
Division.
The Diagnostics Division offers products and services in the
area of in-vitro diagnostics. In-vitro diagnostics is based on the
analysis of bodily fluids such as blood or urine, and supplies
vital information for detecting and managing disease and con-
ducting patient risk assessments. The Division’s product port-
folio represents a comprehensive range of diagnostic testing
systems and consumables, including offerings for clinical
chemistry and immunodiagnostics, molecular diagnostics
(i.e., testing for nucleic acids), hematology, hemostasis, micro-
biology, point-of-care testing and clinical laboratory automa-
tion solutions.
The Customer Solutions Division provides healthcare infor-
mation technology (HIT) systems. It is responsible for the Sec-
tor’s service business and customer relationship management
on a global level. HIT supports users in connection with their
tasks in the clinical, administrative and financial workflow to
support efficient, safe and quality patient care delivery. The
portfolio is comprised of integrated financial and clinical sys-
tems, electronic health record and health information ex-
change as well as an expanding offering of systems optimiza-
tion services. The service business is intended to leverage the
Sector’s installed base of imaging and diagnostics systems
worldwide. In particular, the Division’s experience in remote
and proactive services, innovative service and educational of-
ferings, and logistics processes is intended to differentiate it
Revenue share in % (location of customer)
1 Commenwealth of Independent States.
Americas: %
therein U.S.: %
Asia, Australia: %
Europe, C.I.S.,
Africa, Middle East: %
therein Germany: %