Sony 2000 Annual Report Download - page 42
Download and view the complete annual report
Please find page 42 of the 2000 Sony annual report below. You can navigate through the pages in the report by either clicking on the pages listed below, or by using the keyword search tool below to find specific information within the annual report.-
 1
1 -
2
-
3
-
4
-
5
-
6
-
7
-
8
-
9
-
10
-
11
-
12
-
13
-
14
-
15
-
16
-
17
-
18
-
19
-
20
-
21
-
22
-
23
-
24
-
25
-
26
-
27
-
28
-
29
-
30
-
31
-
 32
32 -
 33
33 -
 34
34 -
 35
35 -
 36
36 -
 37
37 -
 38
38 -
 39
39 -
 40
40 -
 41
41 -
 42
42 -
 43
43 -
 44
44 -
 45
45 -
 46
46 -
 47
47 -
 48
48 -
 49
49 -
 50
50 -
 51
51 -
 52
52 -
53
-
54
-
55
-
56
-
57
-
58
-
59
-
60
-
61
-
62
-
63
-
64
-
65
-
66
-
67
-
68
-
69
-
70
-
71
-
72
-
73
-
74
-
75
-
76
-
77
-
78
-
79
-
80
-
81
-
82
-
83
-
84
-
85
-
86
-
87
-
88
-
89
-
90
-
91
-
92
-
93
-
94
-
95
-
96
-
97
-
98
-
99
-
100
-
101
-
102
 |
 |

SONY CORPORATION ANNUAL REPORT 2000
40
Sony’s financial condition remains strong. Sony believes
that its cash, other liquid assets, free cash flows and access
to capital markets, taken together, provide adequate resources
to fund ongoing operating requirements and future capital
expenditures related to the expansion of existing businesses
and development of new projects.
Assets, Liabilities and Stockholders’ Equity
Total assets increased by 508.1 billion yen, or 8.1%, to 6,807.2
billion yen at March 31, 2000. (Total assets were significantly
affected by currency translation. It is estimated that total as-
sets would have increased by approximately 15% compared
with the previous fiscal year-end if the value of the yen had
remained the same at March 31, 2000 as at the previous
fiscal year-end.) The increase was principally attributable to
increases in goodwill, intangible assets, securities investments
and other, deferred insurance acquisition costs, and notes
and accounts receivable, trade.
Current assets increased by 65.2 billion yen, or 2.1%, to
3,134.6 billion yen at March 31, 2000. This increase was prin-
cipally due to increases in notes and accounts receivable,
trade, while inventories decreased. Among current assets,
liquid assets, comprising cash and cash equivalents, time
deposits, and marketable securities, slightly increased. Notes
and accounts receivable, trade, less allowance for doubtful
accounts and sales returns increased by 41.9 billion yen, or
4.1%, to 1,055.5 billion yen at March 31, 2000 principally due
to sales increases in the Electronics business in the fourth
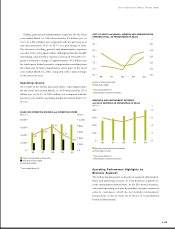
quarter of the fiscal year ended March 31, 2000. Inventories
decreased worldwide by 18.7 billion yen, or 2.1%, to 859.2
billion yen at March 31, 2000 principally due to currency
translation, although they increased at manufacturing facili-
ties especially in Japan, reflecting the start-up of PlayStation
2 in the Game business. The inventory to cost of sales turn-
over ratio (based on the average of inventories at March 31,
1999 and 2000) was 2.27 months, compared with 2.42 months
in the previous year.
Investments and advances increased by 94.9 billion yen,
or 9.7%, to 1,075.6 billion yen at March 31, 2000. This was
principally due to an increase in securities investments and
other although investments and advances to affiliated com-
panies slightly decreased. The decrease in investments and
advances to affiliated companies was principally due to
recording of equity in net losses of affiliated companies. The
increase in securities investments and other was principally
due to higher investment assets in the Insurance business,
reflecting net increases in life insurance-in-force, increases
in unrealized gains on securities investments, and invest-
ments in other companies in such areas as new businesses
in the U.S. during the year. However, sales of certain invest-
ment securities partially offset the increase in securities
investments and other.
Tangible fixed assets increased by 5.8 billion yen, or 0.5%,
to 1,255.6 billion yen at March 31, 2000 principally due to
increases in capital expenditures for semiconductor equip-
ment in the Game business, offset by decreases in capital
expenditures in the Electronics and Music businesses.
Other assets increased by 360.4 billion yen, or 47.8%, to
1,115.0 billion yen at March 31, 2000. Among other assets,
goodwill and intangible assets increased due to the acquisi-
tion transactions whereby three listed subsidiaries became
wholly-owned subsidiaries of Sony Corporation (refer to Note
4 of Notes to Consolidated Financial Statements). In addition,
deferred insurance acquisition costs increased due to net
increases in life insurance-in-force in the Insurance business.
0
200
400
600
800
1,000
0099989796 0
1
2
3
4
5
INVENTORIES and INVENTORY TO COST OF SALES TURNOVER RATIO
Billion ¥ Months
Inventories
Inventory turnover
*As of March 31