Sony 2000 Annual Report Download - page 44
Download and view the complete annual report
Please find page 44 of the 2000 Sony annual report below. You can navigate through the pages in the report by either clicking on the pages listed below, or by using the keyword search tool below to find specific information within the annual report.-
 1
1 -
2
-
3
-
4
-
5
-
6
-
7
-
8
-
9
-
10
-
11
-
12
-
13
-
14
-
15
-
16
-
17
-
18
-
19
-
20
-
21
-
22
-
23
-
24
-
25
-
26
-
27
-
28
-
29
-
30
-
31
-
32
-
33
-
 34
34 -
 35
35 -
 36
36 -
 37
37 -
 38
38 -
 39
39 -
 40
40 -
 41
41 -
 42
42 -
 43
43 -
 44
44 -
 45
45 -
 46
46 -
 47
47 -
 48
48 -
 49
49 -
 50
50 -
 51
51 -
 52
52 -
 53
53 -
 54
54 -
55
-
56
-
57
-
58
-
59
-
60
-
61
-
62
-
63
-
64
-
65
-
66
-
67
-
68
-
69
-
70
-
71
-
72
-
73
-
74
-
75
-
76
-
77
-
78
-
79
-
80
-
81
-
82
-
83
-
84
-
85
-
86
-
87
-
88
-
89
-
90
-
91
-
92
-
93
-
94
-
95
-
96
-
97
-
98
-
99
-
100
-
101
-
102
 |
 |

SONY CORPORATION ANNUAL REPORT 2000
42
Cash Flows
(The fiscal year ended March 31, 2000 compared with the fiscal
year ended March 31, 1999)
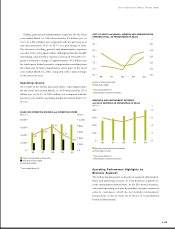
During the fiscal year ended March 31, 2000, Sony generated
579.5 billion yen (a decrease of 83.8 billion yen, or 12.6%,
compared with the previous year) of cash from operating
activities. Sony used 449.9 billion yen (an increase of 82.6
billion yen, or 22.5%, compared with the previous year) in
investing activities. Sony used 68.1 billion yen (a decrease of
44.2 billion yen, or 39.3%, compared with the previous year)
in financing activities. As a result, during the fiscal year ended
March 31, 2000, cash and cash equivalents at end of year
increased by 33.9 billion yen, or 5.7%, notwithstanding the
negative effect of exchange rate changes on cash and cash
equivalents of 27.6 billion yen, to 626.1 billion yen com-
pared with the previous year.
The decrease in net cash provided by operating activities
during the year was principally due to the increases in notes
and accounts receivable as well as inventories in addition to
the decrease in net income, despite the increase in notes
and accounts payable (The decrease in inventories on the
balance sheet was due to the effect of currency translation).
The increase in notes and accounts receivable was princi-
pally due to the sales increases in the Electronics business in
the fourth quarter of the year. Inventories increased princi-
pally at manufacturing facilities in Japan, reflecting the start-
up of PlayStation 2 in the Game business. However, notes
and accounts payable increased due to sales increases noted
above. Increases in future insurance policy benefits and other
were due to net increases in life insurance-in-force in the
Insurance business. Depreciation and amortization (includ-
ing amortization of deferred insurance acquisition costs)
during the year was 306.5 billion yen, which was comprised
of depreciation of fixed assets of approximately 261.0 billion
yen, amortization of intangible assets of approximately 22.8
billion yen, and amortization of deferred insurance acquisi-
tion costs of approximately 22.7 billion yen. A gain on secu-
rities contribution to an employee retirement benefit trust of
58.7 billion yen (pre-tax) in the previous year did not impact
cash flows.
With respect to net cash used in investing activities dur-
ing the year, payments for purchases of fixed assets were
403.0 billion yen. Capital expenditures (additions to fixed
assets on the balance sheets) during the year were 435.9
billion yen. The major components of capital expenditures
(excluding unallocated amounts) were approximately 227.3
billion yen principally for semiconductors and new products
equipment in the Electronics business, approximately 119.0
billion yen principally for semiconductor equipment in the
Game business, approximately 24.6 billion yen principally
for DVD discs equipment in the Music business, approxi-
mately 11.3 billion yen in the Pictures business, and approxi-
mately 48.5 billion yen principally for purchasing leasing
assets in a leasing and credit card business in the Other busi-
ness. Payments for investments and advances and proceeds
from sales of investment securities and collections of ad-
vances were principally from activities in the Insurance busi-
ness. Excluding the Insurance business, payments for
investments and advances during the year included approxi-
mately 56.2 billion yen of investments in other companies in
such areas as new businesses in the U.S. Proceeds from sales
of investment securities and the collections of advances in-
cluded approximately 70.7 billion yen of proceeds from sales
of certain investment securities. In the previous year, cash
flows from investing activities included approximately 53.0
billion yen of proceeds from the merger of Loews Theatres
with Cineplex Odeon Corporation.
With respect to net cash used in financing activities dur-
ing the year, payments of long-term debt included redemp-
tion of unsecured notes due 2000 of 50 billion yen by Sony
Corporation. Sony Corporation paid cash dividends of 20.6
billion yen during the year.
(600)
(400)
(200)
0
200
400
600
800
0099989796
CASH FLOWS
Billion ¥
Cash Flows from Operating activities
Cash Flows from Investing activities
Cash Flows from Financing activities
*Year ended March 31