Sony 2000 Annual Report Download - page 77
Download and view the complete annual report
Please find page 77 of the 2000 Sony annual report below. You can navigate through the pages in the report by either clicking on the pages listed below, or by using the keyword search tool below to find specific information within the annual report.-
 1
1 -
2
-
3
-
4
-
5
-
6
-
7
-
8
-
9
-
10
-
11
-
12
-
13
-
14
-
15
-
16
-
17
-
18
-
19
-
20
-
21
-
22
-
23
-
24
-
25
-
26
-
27
-
28
-
29
-
30
-
31
-
32
-
33
-
34
-
35
-
36
-
37
-
38
-
39
-
40
-
41
-
42
-
43
-
44
-
45
-
46
-
47
-
48
-
49
-
50
-
51
-
52
-
53
-
54
-
55
-
56
-
57
-
58
-
59
-
60
-
61
-
62
-
63
-
64
-
65
-
66
-
 67
67 -
 68
68 -
 69
69 -
 70
70 -
 71
71 -
 72
72 -
 73
73 -
 74
74 -
 75
75 -
 76
76 -
 77
77 -
 78
78 -
 79
79 -
 80
80 -
 81
81 -
 82
82 -
 83
83 -
 84
84 -
 85
85 -
 86
86 -
 87
87 -
88
-
89
-
90
-
91
-
92
-
93
-
94
-
95
-
96
-
97
-
98
-
99
-
100
-
101
-
102
 |
 |

SONY CORPORATION ANNUAL REPORT 2000
75
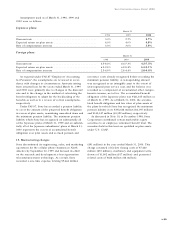
An affiliated company accounted for by the equity
method with carrying amounts of ¥30,684 million and
¥24,958 million ($235 million) at March 31, 1999 and
2000, respectively, was quoted on an established market
at an aggregate value of ¥27,719 million and ¥8,584
million ($81 million), respectively.
Account balances and transactions with affiliated
companies are presented below:
Yen in millions Dollars in millions
March 31 March 31,
1999 2000 2000
Accounts receivable, trade . . . . . . . . . . . . . . . . . . . . . . . . . . . . . . ¥14,744 ¥1 4,453 $136
Accounts payable, trade . . . . . . . . . . . . . . . . . . . . . . . . . . . . . . . 132 1,085 1 0
Yen in millions Dollars in millions
Year ended March 31 Year ended
1998 1999 2000 March 31 , 2000
Sales . . . . . . . . . . . . . . . . . . . . . . . . . . . . . . . . . ¥27,419 ¥25,885 ¥32,045 $302
Purchases . . . . . . . . . . . . . . . . . . . . . . . . . . . . . 3,199 1,932 5,301 50
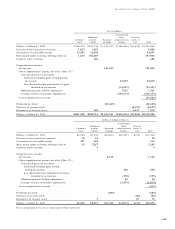
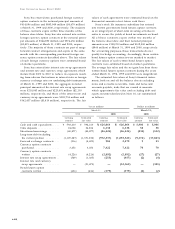
10. Marketable securities and securities investments and other
Marketable securities and securities investments and
other include debt and equity securities of which the
aggregate cost, gross unrealized gains and losses and
fair value pertaining to available-for-sale securities are
as follows:
Yen in millions
March 31, 1999 March 31 , 2000
Gross Gross Gross Gross
unrealized unrealized unrealized unrealized
Cost gains losses Fair value Cost gains losses Fair value
Available-for-sale:
Debt securities. . . . ¥746,005 ¥36,632 ¥12,187 ¥770,450 ¥739,563 ¥ 40,646 ¥7,268 ¥772,941
Equity securities . . . 57,712 13,774 3,156 68,330 55,321 66,905 2,594 11 9,632
Total . . . . . . . . . ¥803,717 ¥50,406 ¥15,343 ¥838,780 ¥794,884 ¥107,551 ¥9,862 ¥892,573
Dollars in millions
March 31 , 2000
Gross Gross
unrealized unrealized
Cost gains losses Fair value
Available-for-sale:
Debt securities. . . . . . . . . . . . . . . . . . . . . . . . . . . . . . . . . . . . . $6,977 $ 384 $69 $7,292
Equity securities . . . . . . . . . . . . . . . . . . . . . . . . . . . . . . . . . . . 522 631 24 1 ,1 29
Total . . . . . . . . . . . . . . . . . . . . . . . . . . . . . . . . . . . . . . . . . . $7,499 $1,015 $93 $8,421
At March 31, 2000, debt securities mainly consist of
Japanese government and municipal bonds and corpo-
rate debt securities due within 1 to 15 years.
Proceeds from sales of available-for-sale securities
were ¥359,815 million, ¥621,045 million and ¥231,419
million ($2,183 million) for the years ended March 31,
1998, 1999 and 2000, respectively. On those sales,
gross realized gains computed on the average cost basis
were ¥18,028 million, ¥9,475 million and ¥21,572 million
($203 million) and gross realized losses were ¥13,793
million, ¥3,554 million and ¥4,376 million ($41 million),
respectively.
Dividends from affiliated companies accounted for
by the equity method for the years ended March 31,
1998, 1999 and 2000 were ¥1,074 million, ¥5,017 million
and ¥869 million ($8 million), respectively.