Sony 2000 Annual Report Download - page 50
Download and view the complete annual report
Please find page 50 of the 2000 Sony annual report below. You can navigate through the pages in the report by either clicking on the pages listed below, or by using the keyword search tool below to find specific information within the annual report.-
 1
1 -
2
-
3
-
4
-
5
-
6
-
7
-
8
-
9
-
10
-
11
-
12
-
13
-
14
-
15
-
16
-
17
-
18
-
19
-
20
-
21
-
22
-
23
-
24
-
25
-
26
-
27
-
28
-
29
-
30
-
31
-
32
-
33
-
34
-
35
-
36
-
37
-
38
-
39
-
 40
40 -
 41
41 -
 42
42 -
 43
43 -
 44
44 -
 45
45 -
 46
46 -
 47
47 -
 48
48 -
 49
49 -
 50
50 -
 51
51 -
 52
52 -
 53
53 -
 54
54 -
 55
55 -
 56
56 -
 57
57 -
 58
58 -
 59
59 -
 60
60 -
61
-
62
-
63
-
64
-
65
-
66
-
67
-
68
-
69
-
70
-
71
-
72
-
73
-
74
-
75
-
76
-
77
-
78
-
79
-
80
-
81
-
82
-
83
-
84
-
85
-
86
-
87
-
88
-
89
-
90
-
91
-
92
-
93
-
94
-
95
-
96
-
97
-
98
-
99
-
100
-
101
-
102
 |
 |

SONY CORPORATION ANNUAL REPORT 2000
48
Game
Sales for the fiscal year ended March 31, 2000 decreased by
129.1 billion yen, or 16.5%, to 654.7 billion yen compared
with the previous year. Operating income decreased by 59.1
billion yen, or 43.3%, to 77.4 billion yen and the operating
margin decreased from 17.4% to 11.8%.
Sales fell due to such factors as decreased shipments of
PlayStation hardware in Japan and the U.S., reflecting high
penetration ratios, as well as strategic price reductions of
hardware in certain areas, although hardware shipments in
Europe increased. The overall decrease in sales was lim-
ited, even during the introduction period of PlayStation 2,
due to higher demand for software especially in the U.S.
and Europe reflecting the increased penetration of
PlayStation hardware.
Worldwide shipments of PlayStation hardware for the fis-
cal year ended March 31, 2000 were 18.50 million units for
the year compared with 21.60 million units for the previous
year, resulting in cumulative shipments of 72.92 million units
as of March 31, 2000. Cumulative shipments of PlayStation 2
hardware, which was introduced in Japan in March 2000,
were 1.41 million units as of March 31, 2000. Worldwide
shipments of PlayStation software (including both Sony and
third parties under Sony licenses) were 200 million units for
the year compared with 194 million units for the previous
year, resulting in cumulative shipments of 630 million units
as of March 31, 2000. In addition, cumulative shipments of
PlayStation 2 software were 2.9 million units.
Profit decreased compared with the previous year due to
the decrease in sales and start-up expenses of PlayStation 2.
Total capital expenditures for the system’s semiconductor
production equipment, the “EmotionEngine” and the “Graph-
ics Synthesizer,” are approximately 130 billion yen, approxi-
mately 110 billion yen of which was incurred during the
year. Sony Computer Entertainment (“SCE”) intends to intro-
duce PlayStation 2 in North America and Europe in October
2000. In line with these introductions, principally aiming at
increases in production for the system, SCE is planning addi-
tional investments for semiconductor production equipment
of approximately 125 billion yen. As a result, cumulative
capital expenditures in semiconductor production equipment
for the system will be approximately 255 billion yen. Based
upon these investments and the increase in semiconductor
production capacity, SCE plans in the future to sell the
PlayStation 2 chipset to third parties and also to work to
develop and sell to third parties next-generation processors
for digital home electronics products.
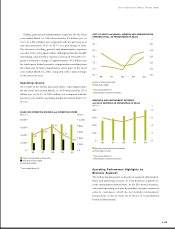
During the year, regarding the geographical breakdown
of Sony’s total production amount (excluding Aiwa, which
represented less than 10% of sales in Sony’s Electronics busi-
ness) and the final destination of such production, more than
half of the total production was in Japan, where production
of digital AV equipment, information and communication
products, and electronic components increased significantly,
and approximately 50% of such production was destined for
other regions. Asia accounted for approximately a quarter of
total production, approximately 70% of which was destined
for other regions. The Americas and Europe together ac-
counted for the remaining quarter of total production, most
of which was destined for use in the respective area of pro-
duction. Regarding consolidation of manufacturing facilities,
during the year, Sony restructured several manufacturing fa-
cilities in North America and emphasized production in
Mexico. In Europe, Sony terminated most of its production
in Germany. In Asia, Sony consolidated several manufactur-
ing facilities in Malaysia and also consolidated several facili-
ties in Singapore. As a result, the number of manufacturing
facilities at the end of March 2000 was reduced to 64, from
70 at the end of March 1999.
Results in the Electronics business were significantly nega-
tively impacted by the yen’s appreciation. On a local cur-
rency basis, sales for the fiscal year ended March 31, 2000
increased approximately 13% and operating income in-
creased approximately 132% compared with the previous
year. This was due to improved profitability principally from
higher demand for such products as PCs and digital AV equip-
ment and increases in sales in almost all regions except for
South America, along with improved efficiencies in manu-
facturing facilities.
Regarding sales by area on a local currency basis, in Ja-
pan, sales of such products as PCs, cellular phones, and
semiconductors increased, while those of AV products such
as color TVs and home-use video decks decreased. In the
U.S., sales of such products as PCs, color TVs and projection
TVs, digital still cameras, DVD-Video players, home-use video
cameras, computer peripherals, and computer displays in-
creased, while those of cellular phones decreased. In Eu-
rope, sales of such products as PCs, home-use video cameras,
home stereos, and DVD-Video players increased in Western
Europe. In Other areas, sales of such products as color TVs,
semiconductors, and home stereos increased in Asia.