Sony 2000 Annual Report Download - page 66
Download and view the complete annual report
Please find page 66 of the 2000 Sony annual report below. You can navigate through the pages in the report by either clicking on the pages listed below, or by using the keyword search tool below to find specific information within the annual report.-
 1
1 -
2
-
3
-
4
-
5
-
6
-
7
-
8
-
9
-
10
-
11
-
12
-
13
-
14
-
15
-
16
-
17
-
18
-
19
-
20
-
21
-
22
-
23
-
24
-
25
-
26
-
27
-
28
-
29
-
30
-
31
-
32
-
33
-
34
-
35
-
36
-
37
-
38
-
39
-
40
-
41
-
42
-
43
-
44
-
45
-
46
-
47
-
48
-
49
-
50
-
51
-
52
-
53
-
54
-
55
-
 56
56 -
 57
57 -
 58
58 -
 59
59 -
 60
60 -
 61
61 -
 62
62 -
 63
63 -
 64
64 -
 65
65 -
 66
66 -
 67
67 -
 68
68 -
 69
69 -
 70
70 -
 71
71 -
 72
72 -
 73
73 -
 74
74 -
 75
75 -
 76
76 -
77
-
78
-
79
-
80
-
81
-
82
-
83
-
84
-
85
-
86
-
87
-
88
-
89
-
90
-
91
-
92
-
93
-
94
-
95
-
96
-
97
-
98
-
99
-
100
-
101
-
102
 |
 |

64
SONY CORPORATION ANNUAL REPORT 2000
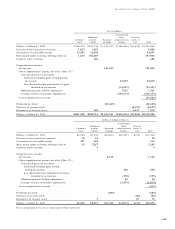
CONSOLIDATED STATEMENTS OF INCOME
Sony Corporation and Consolidated Subsidiaries •Year ended March 31
Dollars in millions
Yen in millions (Note 3)
1998 1999 2000 2000
Sales and operating revenue:
Net sales (Note 9) . . . . . . . . . . . . . . . . . . . . . ¥6,424,805 ¥6,415,418 ¥6,238,401 $58,853
Insurance revenue . . . . . . . . . . . . . . . . . . . . . 291,061 339,368 380,317 3,588
Other operating revenue . . . . . . . . . . . . . . . . 45,138 49,396 67,943 641
6,761,004 6,804,182 6,686,661 63,082
Costs and expenses:
Cost of sales (Notes 15 and 19) . . . . . . . . . . . 4,618,961 4,633,787 4,595,086 43,350
Selling, general and administrative
(Notes 15, 18 and 19) . . . . . . . . . . . . . . . . . 1,345,584 1,500,863 1 ,491 ,560 1 4,071
Insurance expenses . . . . . . . . . . . . . . . . . . . . 270,735 321,320 359,388 3,391
6,235,280 6,455,970 6,446,034 60,812
Operating income . . . . . . . . . . . . . . . . . . . 525,724 348,212 240,627 2,270
Other income:
Interest and dividends (Note 9) . . . . . . . . . . . 20,976 23,313 1 7,700 1 67
Foreign exchange gain, net . . . . . . . . . . . . . . 10,094 2,895 27,466 259
Gain on securities contribution to employee
retirement benefit trust (Note 10) . . . . . . . . . — 58,698 ——
Gain on sale of securities investments
and other, net (Notes 7 and 10) . . . . . . . . . . 739 7,645 28,099 265
Other . . . . . . . . . . . . . . . . . . . . . . . . . . . . . . 52,154 60,354 75,583 713
83,963 152,905 148,848 1 ,404
Other expenses:
Interest . . . . . . . . . . . . . . . . . . . . . . . . . . . . . 62,524 48,275 42,030 397
Other (Note 15) . . . . . . . . . . . . . . . . . . . . . . 87,900 75,151 83,135 784
150,424 123,426 125,1 65 1 ,181
Income before income taxes . . . . . . . . . . . 459,263 377,691 264,310 2,493
Income taxes (Note 16):
Current . . . . . . . . . . . . . . . . . . . . . . . . . . . . . 210,113 158,386 120,803 1 ,1 39
Deferred . . . . . . . . . . . . . . . . . . . . . . . . . . . . 4,755 18,587 (26,1 59) (247)
214,868 176,973 94,644 892
Income before minority interest and equity
in net losses of affiliated companies . . . . 244,395 200,718 1 69,666 1,601
Minority interest in consolidated
subsidiaries . . . . . . . . . . . . . . . . . . . . . . . . 16,813 12,151 10,001 95
Equity in net losses of affiliated companies
(Note 9) . . . . . . . . . . . . . . . . . . . . . . . . . . . 5,514 9,563 37,830 357
Net income . . . . . . . . . . . . . . . . . . . . . . . . . ¥ 222,068 ¥ 179,004 ¥ 1 21 ,835 $ 1 ,149
Yen Dollars (Note 3)
Per share data (Note 5):
Net income — Basic . . . . . . . . . . . . . . . . . . . ¥278.9 ¥218.4 ¥1 44.6 $1 .36
— Diluted. . . . . . . . . . . . . . . . . . 241.7 195.5 131 .7 1 .24
Cash dividends . . . . . . . . . . . . . . . . . . . . . . . 30.0 25.0 25.0 0.24
The a ccompa nying notes a re a n integra l pa rt of these sta tements.