Sony 2000 Annual Report Download - page 46
Download and view the complete annual report
Please find page 46 of the 2000 Sony annual report below. You can navigate through the pages in the report by either clicking on the pages listed below, or by using the keyword search tool below to find specific information within the annual report.-
 1
1 -
2
-
3
-
4
-
5
-
6
-
7
-
8
-
9
-
10
-
11
-
12
-
13
-
14
-
15
-
16
-
17
-
18
-
19
-
20
-
21
-
22
-
23
-
24
-
25
-
26
-
27
-
28
-
29
-
30
-
31
-
32
-
33
-
34
-
35
-
 36
36 -
 37
37 -
 38
38 -
 39
39 -
 40
40 -
 41
41 -
 42
42 -
 43
43 -
 44
44 -
 45
45 -
 46
46 -
 47
47 -
 48
48 -
 49
49 -
 50
50 -
 51
51 -
 52
52 -
 53
53 -
 54
54 -
 55
55 -
 56
56 -
57
-
58
-
59
-
60
-
61
-
62
-
63
-
64
-
65
-
66
-
67
-
68
-
69
-
70
-
71
-
72
-
73
-
74
-
75
-
76
-
77
-
78
-
79
-
80
-
81
-
82
-
83
-
84
-
85
-
86
-
87
-
88
-
89
-
90
-
91
-
92
-
93
-
94
-
95
-
96
-
97
-
98
-
99
-
100
-
101
-
102
 |
 |

SONY CORPORATION ANNUAL REPORT 2000
44
Operating Performance
Note: Effective with the fisca l yea r ended Ma rch 31, 2000, equity in net ea rn-
ings (losses) of a ffilia ted compa nies, which wa s previously included in
sales a nd opera ting revenue, is shown sepa ra tely below income before
income taxes. As a result, sa les a nd opera ting revenue, opera ting in-
come, a nd income before income ta xes figures for the prior yea rs ha ve
been restated to conform to the presenta tion for the fisca l yea r ended
March 31, 2000.
During the fiscal year ended March 31, 2000, the U.S. economy
continued to expand, and the Western European economy
steadily advanced, although economic growth was sluggish
in parts of South America such as Brazil. Eastern Europe and
Russia bottomed out and Asia excluding Japan (“Asia”) con-
tinued its recovery. In Japan, although a clear economic re-
covery could not be seen, demand relating to information
and communication areas was favorable. Under such market
conditions and reflecting the impact of the translation of fi-
nancial results and condition into yen, the currency in which
the financial statements are prepared, in accordance with
U.S. GAAP, Sony’s sales for the fiscal year ended March 31,
2000 decreased 1.7% and operating income decreased 30.9%
compared with the previous year, due to the yen’s apprecia-
tion. The decrease in sales was due to sales decreases in the
Game, Music, and Pictures businesses, while sales increased
in the Electronics, Insurance, and Other businesses. The de-
crease in operating income was due to profit decreases in
the Electronics, Game, Music, and Pictures businesses and
expansion of losses in the Other business, while profit in-
creased in the Insurance business.
On a local currency basis (In connection with all refer-
ences herein to results of operations expressed on a local
currency basis, please refer to “Impact of Foreign Exchange
Fluctuations and Basic Countermeasures” on page 43.), Sony’s
sales for the year ended March 31, 2000 increased approxi-
mately 9% and operating income increased approximately
39% compared with the previous year.
On January 5, 2000, the acquisition transactions by way
of exchanges of stock, whereby SMEJ, Sony Chemicals Cor-
poration, and Sony Precision Technology Inc. became wholly-
owned subsidiaries of Sony Corporation, were completed
(refer to Note 4 of Notes to Consolidated Financial Statements).
As a result, of the approximately 348 billion yen which rep-
resented the increase in total capital (equivalent to the pur-
chase price from external shareholders) of Sony Corporation,
approximately 236 billion yen, which represents the excess
of this amount over the total book value of the minority
interests in the three subsidiaries, was recorded as tangible
and intangible assets and goodwill of approximately 283 bil-
lion yen and as deferred tax liabilities of approximately 47
billion yen. The breakdown of the 236 billion yen is ap-
proximately 58 billion yen in the Electronics business, 158
billion yen in the Game business, and 20 billion yen in the
Music business. These intangible assets and goodwill will be
amortized over the useful life of up to a maximum of 20
years starting in the fourth quarter of the fiscal year ended
March 31, 2000, and recorded in selling, general and admin-
istrative expenses. At the same time, the corresponding de-
ferred tax liabilities will be reversed. During the fourth quarter,
as a result of these factors, operating income and income
before income taxes each decreased approximately 4.2 bil-
lion yen, and net income decreased approximately 3.3 bil-
lion yen. In addition, as a result of these transactions, minority
interests in the three subsidiaries was eliminated and income
or loss in minority interests in such subsidiaries is not recog-
nized after January 5, 2000, the date of the transactions.
Sales
Sales for the fiscal year ended March 31, 2000 decreased by
117.5 billion yen, or 1.7%, to 6,686.7 billion yen compared
with the previous year, for the reasons discussed above.
Cost of Sales and Selling, General and Administrative
Expenses (Excluding the Insurance Business)
Cost of sales for the fiscal year ended March 31, 2000 de-
creased by 38.7 billion yen, or 0.8%, to 4,595.1 billion yen
compared with the previous year and increased from 71.7%
to 72.9% as a percentage of sales. The decrease of cost of
sales was due to the yen’s appreciation, although manufac-
turing expenses and research and development expenses
increased, reflecting increases in production brought about
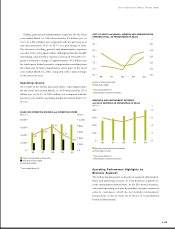
by favorable demand. Research and development expenses
for the fiscal year ended March 31, 2000 increased by 19.2
billion yen, or 5.1%, to 394.5 billion yen compared with the
previous year and increased from 5.8% to 6.3% as a percent-
age of sales. Major areas of the research and development
expenses during the year were the Electronics business, for
semiconductors, telecommunications, and displays, and the
Game business.