Sony 2000 Annual Report Download - page 53
Download and view the complete annual report
Please find page 53 of the 2000 Sony annual report below. You can navigate through the pages in the report by either clicking on the pages listed below, or by using the keyword search tool below to find specific information within the annual report.-
 1
1 -
2
-
3
-
4
-
5
-
6
-
7
-
8
-
9
-
10
-
11
-
12
-
13
-
14
-
15
-
16
-
17
-
18
-
19
-
20
-
21
-
22
-
23
-
24
-
25
-
26
-
27
-
28
-
29
-
30
-
31
-
32
-
33
-
34
-
35
-
36
-
37
-
38
-
39
-
40
-
41
-
42
-
 43
43 -
 44
44 -
 45
45 -
 46
46 -
 47
47 -
 48
48 -
 49
49 -
 50
50 -
 51
51 -
 52
52 -
 53
53 -
 54
54 -
 55
55 -
 56
56 -
 57
57 -
 58
58 -
 59
59 -
 60
60 -
 61
61 -
 62
62 -
 63
63 -
64
-
65
-
66
-
67
-
68
-
69
-
70
-
71
-
72
-
73
-
74
-
75
-
76
-
77
-
78
-
79
-
80
-
81
-
82
-
83
-
84
-
85
-
86
-
87
-
88
-
89
-
90
-
91
-
92
-
93
-
94
-
95
-
96
-
97
-
98
-
99
-
100
-
101
-
102
 |
 |

SONY CORPORATION ANNUAL REPORT 2000
51
Other
The Other business consisted of various operating activities,
including a leasing and credit card business in Japan, a busi-
ness focused on parts trading services within the Sony group,
certain satellite distribution services businesses in Japan, an
advertising agency business in Japan, an Internet-related
business in the U.S., and a location-based entertainment com-
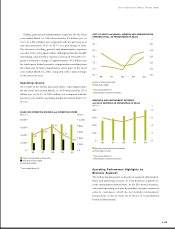
plex in the U.S. Sales for the fiscal year ended March 31,
2000 were up by 72.5 billion yen, or 24.9%, to 364.1 billion
yen, compared with the previous year. Approximately 70
percent of sales in the Other business reflected intersegment
transactions during the year. The business posted an operat-
ing loss of 12.9 billion yen.
During the year, sales increased primarily due to a sub-
sidiary engaged in an advertising agency business being newly
consolidated and increased sales of a subsidiary engaged in
a parts trading services business within the Sony group. Losses
were recorded primarily from the location-based entertain-
ment complex in the U.S. and certain satellite distribution
services businesses in Japan.
Regarding the location-based entertainment complexes
business, an entertainment complex including stores and
theatres in San Francisco opened in June 1999. Total invest-
ment for this project was approximately 13.8 billion yen. In
addition, a location-based entertainment complex business
that opened in Tokyo in April 2000 will be included in the
Other business starting in the fiscal year ending March 31,
2001. Total investment for this project was approximately
13.0 billion yen.
Condensed balance sheets (unaudited)
March 31 Sony with Insurance business
Insurance business on the equity basis
Yen in millions 1999 2000 1999 2000
ASSETS
Cash and time deposits . . . . . . . . . . . . . . . . . . ¥ 114,695 ¥ 218,995 ¥ 501,819 ¥ 413,207
Marketable securities . . . . . . . . . . . . . . . . . . . . 62,112 87,539 55,745 19,960
Other current assets . . . . . . . . . . . . . . . . . . . . 10,000 12,331 2,326,837 2,384,161
Investments and advances . . . . . . . . . . . . . . . . 720,020 810,963 260,716 264,631
Investments in insurance operations. . . . . . . . . ––133,546 159,821
Deferred insurance acquisition costs . . . . . . . . 199,868 239,981 ––
Other long-term assets. . . . . . . . . . . . . . . . . . . 22,310 13,908 2,027,909 2,345,094
¥1,129,005 ¥1,383,717 ¥5,306,572 ¥5,586,874
LIABILITIES AND STOCKHOLDERS’ EQUITY
Future insurance policy benefits
and other . . . . . . . . . . . . . . . . . . . . . . . . . . ¥ 913,937 ¥1,124,873 ––
Other liabilities and minority interest . . . . . . . . 81,226 98,356 ¥3,482,907 ¥3,403,968
Total liabilities and minority interest . . . . . . . . . 995,163 1,223,229 3,482,907 3,403,968
Stockholders’ equity . . . . . . . . . . . . . . . . . . . . 133,842 160,488 1,823,665 2,182,906
¥1,129,005 ¥1,383,717 ¥5,306,572 ¥5,586,874
0
100
200
300
400
(20)
0
0099989796
SALES and OPERATING INCOME (LOSS) IN OTHER BUSINESS
Billion ¥ Billion ¥
Sales (left)
Operating income (loss) (right)
*Year ended March 31