Sony 2000 Annual Report Download - page 52
Download and view the complete annual report
Please find page 52 of the 2000 Sony annual report below. You can navigate through the pages in the report by either clicking on the pages listed below, or by using the keyword search tool below to find specific information within the annual report.-
 1
1 -
2
-
3
-
4
-
5
-
6
-
7
-
8
-
9
-
10
-
11
-
12
-
13
-
14
-
15
-
16
-
17
-
18
-
19
-
20
-
21
-
22
-
23
-
24
-
25
-
26
-
27
-
28
-
29
-
30
-
31
-
32
-
33
-
34
-
35
-
36
-
37
-
38
-
39
-
40
-
41
-
 42
42 -
 43
43 -
 44
44 -
 45
45 -
 46
46 -
 47
47 -
 48
48 -
 49
49 -
 50
50 -
 51
51 -
 52
52 -
 53
53 -
 54
54 -
 55
55 -
 56
56 -
 57
57 -
 58
58 -
 59
59 -
 60
60 -
 61
61 -
 62
62 -
63
-
64
-
65
-
66
-
67
-
68
-
69
-
70
-
71
-
72
-
73
-
74
-
75
-
76
-
77
-
78
-
79
-
80
-
81
-
82
-
83
-
84
-
85
-
86
-
87
-
88
-
89
-
90
-
91
-
92
-
93
-
94
-
95
-
96
-
97
-
98
-
99
-
100
-
101
-
102
 |
 |

SONY CORPORATION ANNUAL REPORT 2000
50
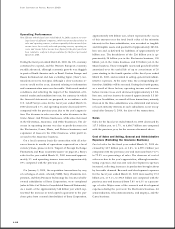
Results in the Pictures business were significantly nega-
tively impacted by the yen’s appreciation. On a local cur-
rency basis, sales for the fiscal year ended March 31, 2000
increased approximately 3% and operating income increased
approximately 3% compared with the previous year.
In January 2000, Sony and Starz Encore Media Group LLC
(“Starz Encore”), a provider of cable and satellite-delivered
premium movie channels in the U.S., jointly announced that
they had entered into a long-term strategic partnership which
includes a license agreement that, beginning in January 2005,
grants Starz Encore exclusive, first-run pay television rights
to all films released theatrically in the U.S. by Sony during
the initial 6 year term of the agreement, with Sony having
the option to extend the term for an additional 3 years. Un-
der the agreement, Sony retains the right to distribute its
films on the Internet via video-on-demand during the Starz
Encore “window” in the future broadband network era.
Condensed insurance business balance sheets
The Insurance business is included on a consolidated basis
in Sony’s consolidated financial statements. The following
schedule shows unaudited condensed balance sheets for the
Insurance business and for Sony with the Insurance busi-
ness’ financial position reflected on the equity basis. (Al-
though inter-business balances between the Insurance
business and businesses other than the Insurance business
are not eliminated in the respective balance sheets shown
below, such amounts are not material.) While this presenta-
tion differs from that provided under U.S. GAAP used in
Sony’s consolidated financial statements, because the Insur-
ance business is different in nature from Sony’s Electronics,
Game, Music, and Pictures businesses, Sony believes that
this type of comparative presentation helps the understand-
ing and analysis of Sony’s consolidated financial statements.
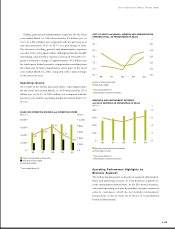
Insurance
Insurance revenue for the fiscal year ended March 31, 2000
increased by 41.0 billion yen, or 12.1%, to 380.3 billion yen
compared with the previous year. Operating income increased
by 2.9 billion yen, or 16.0%, to 20.9 billion yen and the oper-
ating margin increased from 5.3% to 5.5%.
During the fiscal year ended March 31, 2000, regarding
results of Sony Life Insurance Co., Ltd., revenue and profit
increased due to an increase in life insurance-in-force and
improved returns on investment income. Life insurance-in-
force increased in high margin individual life insurance prod-
ucts such as whole life and medical expense coverage.
However, losses were recorded from start-up expenses for
Sony Assurance Inc.
0
200
400
600
800
0
50
100
150
200
0099989796
7.4% 6.6%
5.7%
7.9% 7.8%
SALES and OPERATING INCOME IN PICTURES BUSINESS
Billion ¥ Billion ¥
Sales (left)
Operating income (right)
Operating margin
*Year ended March 31
0
100
200
300
400
0
20
40
60
80
0099989796
3.4%
8.4%
7.0%
5.3% 5.5%
INSURANCE REVENUE and OPERATING INCOME
IN INSURANCE BUSINESS
Billion ¥ Billion ¥
Insurance revenue (left)
Operating income (right)
Operating margin
*Year ended March 31