Sony 2000 Annual Report Download - page 64
Download and view the complete annual report
Please find page 64 of the 2000 Sony annual report below. You can navigate through the pages in the report by either clicking on the pages listed below, or by using the keyword search tool below to find specific information within the annual report.-
 1
1 -
2
-
3
-
4
-
5
-
6
-
7
-
8
-
9
-
10
-
11
-
12
-
13
-
14
-
15
-
16
-
17
-
18
-
19
-
20
-
21
-
22
-
23
-
24
-
25
-
26
-
27
-
28
-
29
-
30
-
31
-
32
-
33
-
34
-
35
-
36
-
37
-
38
-
39
-
40
-
41
-
42
-
43
-
44
-
45
-
46
-
47
-
48
-
49
-
50
-
51
-
52
-
53
-
 54
54 -
 55
55 -
 56
56 -
 57
57 -
 58
58 -
 59
59 -
 60
60 -
 61
61 -
 62
62 -
 63
63 -
 64
64 -
 65
65 -
 66
66 -
 67
67 -
 68
68 -
 69
69 -
 70
70 -
 71
71 -
 72
72 -
 73
73 -
 74
74 -
75
-
76
-
77
-
78
-
79
-
80
-
81
-
82
-
83
-
84
-
85
-
86
-
87
-
88
-
89
-
90
-
91
-
92
-
93
-
94
-
95
-
96
-
97
-
98
-
99
-
100
-
101
-
102
 |
 |

62
SONY CORPORATION ANNUAL REPORT 2000
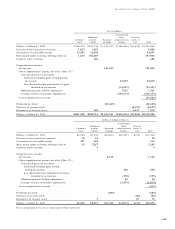
CONSOLIDATED BALANCE SHEETS
Sony Corporation and Consolidated Subsidiaries •March 31
Dollars in millions
Yen in millions (Note 3)
1999 2000 2000
ASSETS
Current assets:
Cash and cash equivalents (Note 13) . . . . . . . . . . . . . . . . . . ¥ 592,210 ¥ 626,064 $ 5,906
Time deposits (Note 13) . . . . . . . . . . . . . . . . . . . . . . . . . . . 24,304 6,1 38 58
Marketable securities (Note 10) . . . . . . . . . . . . . . . . . . . . . . 117,857 107,499 1 ,01 4
Notes and accounts receivable, trade (Note 9) . . . . . . . . . . . 1,135,598 1,1 56,065 1 0,906
Allowance for doubtful accounts and sales returns . . . . . . . . (122,015) (100,596) (949)
Inventories (Note 8) . . . . . . . . . . . . . . . . . . . . . . . . . . . . . . 877,898 859,174 8,1 06
Deferred income taxes (Note 16) . . . . . . . . . . . . . . . . . . . . . 102,588 11 7,258 1 ,106
Prepaid expenses and other current assets . . . . . . . . . . . . . . 340,953 363,038 3,425
Total current assets . . . . . . . . . . . . . . . . . . . . . . . . . . . 3,069,393 3,134,640 29,572
Noncurrent inventories—film (Note 8) . . . . . . . . . . . . . . 244,537 226,387 2,136
Investments and advances:
Affiliated companies (Note 9) . . . . . . . . . . . . . . . . . . . . . . . 116,786 11 4,670 1 ,082
Securities investments and other (Note 10) . . . . . . . . . . . . . . 863,950 960,924 9,065
980,736 1,075,594 10,1 47
Property, plant and equipment (Notes 11 and 20):
Land . . . . . . . . . . . . . . . . . . . . . . . . . . . . . . . . . . . . . . . . . . 191,434 185,736 1 ,752
Buildings . . . . . . . . . . . . . . . . . . . . . . . . . . . . . . . . . . . . . . 781,876 774,372 7,306
Machinery and equipment . . . . . . . . . . . . . . . . . . . . . . . . . . 1,952,276 1,955,01 5 18,444
Construction in progress . . . . . . . . . . . . . . . . . . . . . . . . . . . 76,736 92,787 875
3,002,322 3,007,910 28,377
Less—Accumulated depreciation . . . . . . . . . . . . . . . . . . . . . 1,752,571 1 ,752,340 1 6,532
1,249,751 1,255,570 11 ,845
Other assets:
Intangibles, net (Notes 6 and 14) . . . . . . . . . . . . . . . . . . . . . 123,272 218,496 2,061
Goodwill, net (Note 6) . . . . . . . . . . . . . . . . . . . . . . . . . . . . 139,888 293,777 2,772
Deferred insurance acquisition costs (Note 12) . . . . . . . . . . . 199,868 239,981 2,264
Other (Note 16) . . . . . . . . . . . . . . . . . . . . . . . . . . . . . . . . . 291,608 362,752 3,422
754,636 1,1 15,006 10,51 9
¥6,299,053 ¥6,807,197 $64,219
The a ccompa nying notes a re a n integra l pa rt of these sta tements.