Sony 2000 Annual Report Download - page 67
Download and view the complete annual report
Please find page 67 of the 2000 Sony annual report below. You can navigate through the pages in the report by either clicking on the pages listed below, or by using the keyword search tool below to find specific information within the annual report.-
 1
1 -
2
-
3
-
4
-
5
-
6
-
7
-
8
-
9
-
10
-
11
-
12
-
13
-
14
-
15
-
16
-
17
-
18
-
19
-
20
-
21
-
22
-
23
-
24
-
25
-
26
-
27
-
28
-
29
-
30
-
31
-
32
-
33
-
34
-
35
-
36
-
37
-
38
-
39
-
40
-
41
-
42
-
43
-
44
-
45
-
46
-
47
-
48
-
49
-
50
-
51
-
52
-
53
-
54
-
55
-
56
-
 57
57 -
 58
58 -
 59
59 -
 60
60 -
 61
61 -
 62
62 -
 63
63 -
 64
64 -
 65
65 -
 66
66 -
 67
67 -
 68
68 -
 69
69 -
 70
70 -
 71
71 -
 72
72 -
 73
73 -
 74
74 -
 75
75 -
 76
76 -
 77
77 -
78
-
79
-
80
-
81
-
82
-
83
-
84
-
85
-
86
-
87
-
88
-
89
-
90
-
91
-
92
-
93
-
94
-
95
-
96
-
97
-
98
-
99
-
100
-
101
-
102
 |
 |

SONY CORPORATION ANNUAL REPORT 2000
65
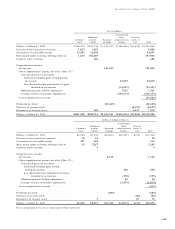
CONSOLIDATED STATEMENTS OF CASH FLOWS
Sony Corporation and Consolidated Subsidiaries •Year ended March 31
Dollars in millions
Yen in millions (Note 3)
1998 1999 2000 2000
Cash flows from operating activities:
Net income . . . . . . . . . . . . . . . . . . . . . . . . . . . . . . . . . . . . . . . . . . ¥ 222,068 ¥ 179,004 ¥ 1 21 ,835 $ 1 ,1 49
Adjustments to reconcile net income to net cash
provided by operating activities—
Depreciation and amortization, including amortization
of deferred insurance acquisition costs . . . . . . . . . . . . . . . . . 301,665 307,173 306,505 2,892
Accrual for pension and severance costs, less payments . . . . . . 40,367 25,817 22,860 21 6
Loss on disposal of fixed assets . . . . . . . . . . . . . . . . . . . . . . . . 22,678 15,079 18,849 178
Gain on securities contribution to employee retirement
benefit trust (Note 10) . . . . . . . . . . . . . . . . . . . . . . . . . . . . . . — (58,698) ——
Deferred income taxes . . . . . . . . . . . . . . . . . . . . . . . . . . . . . . 4,755 18,587 (26,159) (247)
Equity in net losses of affiliated companies, net of dividends . . . 6,588 14,580 38,699 365
Changes in assets and liabilities:
(Increase) decrease in notes and accounts receivable . . . . . . (113,050) 38,942 (1 32,566) (1 ,251)
(Increase) decrease in inventories . . . . . . . . . . . . . . . . . . . . (96,138) 70,693 (35,498) (335)
Increase in film inventories . . . . . . . . . . . . . . . . . . . . . . . . . (7,194) (27,103) (34,330) (324)
Increase (decrease) in notes and accounts payable . . . . . . . . 109,785 (24,063) 11 0,207 1,040
Decrease in accrued income and other taxes . . . . . . . . . . . . (28,775) (30,125) (15,433) (145)
Increase in future insurance policy benefits and other . . . . . 134,707 199,967 21 0,936 1 ,990
Increase in deferred insurance acquisition costs . . . . . . . . . . (39,553) (57,417) (62,821 ) (593)
Changes in other current assets and liabilities, net . . . . . . . . 86,203 55,286 87,328 824
Other. . . . . . . . . . . . . . . . . . . . . . . . . . . . . . . . . . . . . . . . . . . (31,756) (64,455) (30,949) (292)
Net cash provided by operating activities . . . . . . . . . . . . . . 612,350 663,267 579,463 5,467
Cash flows from investing activities:
Payments for purchases of fixed assets . . . . . . . . . . . . . . . . . . . . . (378,053) (368,355) (403,01 3) (3,802)
Proceeds from sales of fixed assets . . . . . . . . . . . . . . . . . . . . . . . . 22,413 28,783 29,077 274
Payments for investments and advances by insurance business . . . (398,779) (651,226) (1 78,866) (1,687)
Payments for investments and advances
(other than insurance business) . . . . . . . . . . . . . . . . . . . . . . . . . . (64,460) (89,827) (1 05,031 ) (991 )
Proceeds from sales of investment securities and collections of
advances by insurance business . . . . . . . . . . . . . . . . . . . . . . . . . . 297,186 498,738 97,200 917
Proceeds from sales of investment securities and
collections of advances (other than insurance business) . . . . . . . . 26,257 31,359 86,493 81 6
Proceeds from merger of Loews Theatres exhibition business
(Note 7) . . . . . . . . . . . . . . . . . . . . . . . . . . . . . . . . . . . . . . . . . . . — 53,007 ——
Payments for purchases of marketable securities . . . . . . . . . . . . . . (95,163) (121,483) (70,053) (661 )
Proceeds from sales of marketable securities . . . . . . . . . . . . . . . . . 46,730 171,868 78,370 739
(Increase) decrease in time deposits. . . . . . . . . . . . . . . . . . . . . . . . (54,831) 79,876 15,930 1 50
Net cash used in investing activities . . . . . . . . . . . . . . . . . . . (598,700) (367,260) (449,893) (4,245)
Cash flows from financing activities:
Proceeds from issuance of long-term debt . . . . . . . . . . . . . . . . . . . 342,101 54,208 30,783 290
Payments of long-term debt. . . . . . . . . . . . . . . . . . . . . . . . . . . . . . (332,154) (69,889) (99,454) (938)
Increase (decrease) in short-term borrowings . . . . . . . . . . . . . . . . . (2,345) (71,601) 1 9,824 1 87
Dividends paid . . . . . . . . . . . . . . . . . . . . . . . . . . . . . . . . . . . . . . . (21,582) (24,501) (20,589) (194)
Other . . . . . . . . . . . . . . . . . . . . . . . . . . . . . . . . . . . . . . . . . . . . . . (3,790) (445) 1,361 1 3
Net cash used in financing activities . . . . . . . . . . . . . . . . . . (17,770) (112,228) (68,075) (642)
Effect of exchange rate changes on cash and cash equivalents . . . . (1,112) (14,855) (27,641 ) (261 )
Net increase (decrease) in cash and cash equivalents . . . . . . . . . . . (5,232) 168,924 33,854 31 9
Cash and cash equivalents at beginning of year . . . . . . . . . . . . . . . 428,518 423,286 592,210 5,587
Cash and cash equivalents at end of year . . . . . . . . . . . . . . . . . . . . ¥ 423,286 ¥ 592,210 ¥ 626,064 $ 5,906
Supplemental data:
Cash paid during the year for—
Income taxes . . . . . . . . . . . . . . . . . . . . . . . . . . . . . . . . . . . . . . . ¥ 239,054 ¥ 191,378 ¥ 1 32,891 $ 1 ,254
Interest . . . . . . . . . . . . . . . . . . . . . . . . . . . . . . . . . . . . . . . . . . . 64,102 49,096 43,668 41 2
Non-cash investing and financing activities—
Integration of three listed subsidiaries through exchange
offerings (Note 4)
Fair value of assets acquired . . . . . . . . . . . . . . . . . . . . . . . . . . — — ¥ 282,488 $ 2,665
Deferred tax liabilities thereon . . . . . . . . . . . . . . . . . . . . . . . . — — (46,794) (442)
Minority interest eliminated . . . . . . . . . . . . . . . . . . . . . . . . . . — — 1 1 2,242 1 ,059
Net . . . . . . . . . . . . . . . . . . . . . . . . . . . . . . . . . . . . . . . . . — — ¥ 347,936 $ 3,282
The a ccompa nying notes a re a n integra l pa rt of these sta tements.