Sony 2000 Annual Report Download - page 45
Download and view the complete annual report
Please find page 45 of the 2000 Sony annual report below. You can navigate through the pages in the report by either clicking on the pages listed below, or by using the keyword search tool below to find specific information within the annual report.-
 1
1 -
2
-
3
-
4
-
5
-
6
-
7
-
8
-
9
-
10
-
11
-
12
-
13
-
14
-
15
-
16
-
17
-
18
-
19
-
20
-
21
-
22
-
23
-
24
-
25
-
26
-
27
-
28
-
29
-
30
-
31
-
32
-
33
-
34
-
 35
35 -
 36
36 -
 37
37 -
 38
38 -
 39
39 -
 40
40 -
 41
41 -
 42
42 -
 43
43 -
 44
44 -
 45
45 -
 46
46 -
 47
47 -
 48
48 -
 49
49 -
 50
50 -
 51
51 -
 52
52 -
 53
53 -
 54
54 -
 55
55 -
56
-
57
-
58
-
59
-
60
-
61
-
62
-
63
-
64
-
65
-
66
-
67
-
68
-
69
-
70
-
71
-
72
-
73
-
74
-
75
-
76
-
77
-
78
-
79
-
80
-
81
-
82
-
83
-
84
-
85
-
86
-
87
-
88
-
89
-
90
-
91
-
92
-
93
-
94
-
95
-
96
-
97
-
98
-
99
-
100
-
101
-
102
 |
 |

SONY CORPORATION ANNUAL REPORT 2000
43
RESULTS OF OPERATIONS
(The fiscal year ended March 31, 2000 compared with the fiscal
year ended March 31, 1999)
Impact of Foreign Exchange Fluctuations and
Basic Countermeasures
During the fiscal year ended March 31, 2000, the average
value of the yen was 110.6 yen against the U.S. dollar, and
113.9 yen against the euro, which was 14.8% and 24.9% higher
against the U.S. dollar and euro, respectively, compared with
the level of the previous year. (For comparative purposes
only, the euro until December 1998 is hypothetically com-
puted based on the German mark.) Operating results on a
local currency basis described in “Consolidated Results” show
results of sales and operating revenue (“sales”) and operat-
ing income obtained by applying the yen’s average exchange
rate in the previous year to local currency-denominated sales,
cost of sales, and selling, general and administrative expenses
for the fiscal year ended March 31, 2000, assuming the value
of the yen had remained the same. Regarding the U.S. based
Music and Pictures businesses, results of worldwide subsid-
iaries (in the case of Music, excluding those of Japan) are
consolidated on a U.S. dollar basis. Local currency basis re-
sults are not reflected in Sony’s financial statements and are
not measures conforming with Generally Accepted Account-
ing Principles in the U.S. (“U.S. GAAP”). Also, Sony does not
believe that these measures are a substitute for U.S. GAAP
measures. However, Sony believes that local currency basis
results provide additional useful information to investors re-
garding operating performance.
Sony employs foreign exchange forward contracts and
foreign currency option contracts to hedge against foreign
exchange risks that arise from its export and import transac-
tions of materials, parts, and products. Furthermore, particu-
larly in the Electronics business, to minimize the adverse
effects of foreign exchange fluctuations on its financial re-
sults and to reduce inventory and costs, Sony seeks, when
appropriate, to localize material and parts procurement, de-
sign, and manufacturing operations outside Japan.
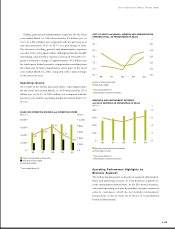
0
100
200
300
400
0099989796
DEPRECIATION AND AMORTIZATION
Billion ¥
0
100
200
300
400
500
0099989796
CAPITAL EXPENDITURES
(ADDITIONS TO FIXED ASSETS)
Billion ¥
*Year ended March 31
*Including amortization of deffered insurance acquisition costs
*Year ended March 31