Sony 2000 Annual Report Download - page 98
Download and view the complete annual report
Please find page 98 of the 2000 Sony annual report below. You can navigate through the pages in the report by either clicking on the pages listed below, or by using the keyword search tool below to find specific information within the annual report.-
 1
1 -
2
-
3
-
4
-
5
-
6
-
7
-
8
-
9
-
10
-
11
-
12
-
13
-
14
-
15
-
16
-
17
-
18
-
19
-
20
-
21
-
22
-
23
-
24
-
25
-
26
-
27
-
28
-
29
-
30
-
31
-
32
-
33
-
34
-
35
-
36
-
37
-
38
-
39
-
40
-
41
-
42
-
43
-
44
-
45
-
46
-
47
-
48
-
49
-
50
-
51
-
52
-
53
-
54
-
55
-
56
-
57
-
58
-
59
-
60
-
61
-
62
-
63
-
64
-
65
-
66
-
67
-
68
-
69
-
70
-
71
-
72
-
73
-
74
-
75
-
76
-
77
-
78
-
79
-
80
-
81
-
82
-
83
-
84
-
85
-
86
-
87
-
 88
88 -
 89
89 -
 90
90 -
 91
91 -
 92
92 -
 93
93 -
 94
94 -
 95
95 -
 96
96 -
 97
97 -
 98
98 -
 99
99 -
 100
100 -
 101
101 -
 102
102
 |
 |

96
SONY CORPORATION ANNUAL REPORT 2000
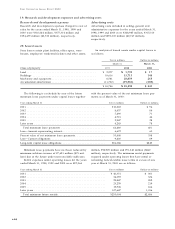
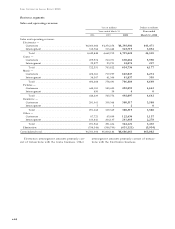
The following information shows sales and operating
revenue and operating income by geographic origin for
the years ended March 31, 1998, 1999 and 2000. In
addition to the disclosure requirements under FAS 131,
Sony discloses this supplemental information in accor-
dance with disclosure requirements of the Japanese
Securities and Exchange Law, to which Sony, as a
Japanese public company, is subject.
Yen in millions Dollars in millions
Year ended March 31 Year ended
1998 1999 2000 March 31 , 2000
Sales and operating revenue:
Japan—
Customers . . . . . . . . . . . . . . . . . . . . . . . . . . ¥ 2,366,871 ¥ 2,345,717 ¥ 2,560,839 $ 24,1 59
Intersegment . . . . . . . . . . . . . . . . . . . . . . . . 1,697,655 1,822,282 1,837,048 17,330
Total . . . . . . . . . . . . . . . . . . . . . . . . . . . 4,064,526 4,167,999 4,397,887 41 ,489
U.S.A.—
Customers . . . . . . . . . . . . . . . . . . . . . . . . . . 2,155,110 2,232,816 2,082,505 1 9,646
Intersegment . . . . . . . . . . . . . . . . . . . . . . . . 153,603 140,239 1 70,889 1 ,612
Total . . . . . . . . . . . . . . . . . . . . . . . . . . . 2,308,713 2,373,055 2,253,394 21 ,258
Europe—
Customers . . . . . . . . . . . . . . . . . . . . . . . . . . 1,340,334 1,480,076 1,302,91 7 1 2,292
Intersegment . . . . . . . . . . . . . . . . . . . . . . . . 62,506 65,466 48,751 460
Total . . . . . . . . . . . . . . . . . . . . . . . . . . . 1,402,840 1,545,542 1,351 ,668 1 2,752
Other—
Customers . . . . . . . . . . . . . . . . . . . . . . . . . . 898,689 745,573 740,400 6,985
Intersegment . . . . . . . . . . . . . . . . . . . . . . . . 715,156 724,240 71 8,321 6,777
Total . . . . . . . . . . . . . . . . . . . . . . . . . . . 1,613,845 1,469,813 1,458,721 13,762
Elimination . . . . . . . . . . . . . . . . . . . . . . . . . . . (2,628,920) (2,752,227) (2,775,009) (26,1 79)
Consolidated total . . . . . . . . . . . . . . . . . . . . . . . . ¥ 6,761,004 ¥ 6,804,182 ¥ 6,686,661 $ 63,082
Operating income:
Japan . . . . . . . . . . . . . . . . . . . . . . . . . . . . . . . ¥ 353,595 ¥ 215,416 ¥ 99,943 $ 943
U.S.A. . . . . . . . . . . . . . . . . . . . . . . . . . . . . . . . 74,757 78,909 97,993 924
Europe . . . . . . . . . . . . . . . . . . . . . . . . . . . . . . 76,166 81,080 51,928 490
Other . . . . . . . . . . . . . . . . . . . . . . . . . . . . . . . 68,828 47,771 73,952 698
Corporate and elimination . . . . . . . . . . . . . . . . (47,622) (74,964) (83,1 89) (785)
Consolidated total . . . . . . . . . . . . . . . . . . . . . . . . ¥ 525,724 ¥ 348,212 ¥ 240,627 $ 2,270