Sony 2000 Annual Report Download - page 97
Download and view the complete annual report
Please find page 97 of the 2000 Sony annual report below. You can navigate through the pages in the report by either clicking on the pages listed below, or by using the keyword search tool below to find specific information within the annual report.-
 1
1 -
2
-
3
-
4
-
5
-
6
-
7
-
8
-
9
-
10
-
11
-
12
-
13
-
14
-
15
-
16
-
17
-
18
-
19
-
20
-
21
-
22
-
23
-
24
-
25
-
26
-
27
-
28
-
29
-
30
-
31
-
32
-
33
-
34
-
35
-
36
-
37
-
38
-
39
-
40
-
41
-
42
-
43
-
44
-
45
-
46
-
47
-
48
-
49
-
50
-
51
-
52
-
53
-
54
-
55
-
56
-
57
-
58
-
59
-
60
-
61
-
62
-
63
-
64
-
65
-
66
-
67
-
68
-
69
-
70
-
71
-
72
-
73
-
74
-
75
-
76
-
77
-
78
-
79
-
80
-
81
-
82
-
83
-
84
-
85
-
86
-
 87
87 -
 88
88 -
 89
89 -
 90
90 -
 91
91 -
 92
92 -
 93
93 -
 94
94 -
 95
95 -
 96
96 -
 97
97 -
 98
98 -
 99
99 -
 100
100 -
 101
101 -
 102
102
 |
 |

SONY CORPORATION ANNUAL REPORT 2000
95
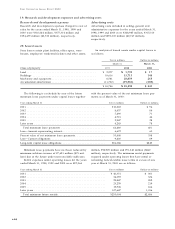
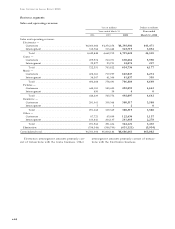
Geographic information
Sales and operating revenue which are attributed to
countries based on location of customers and long-lived
Yen in millions Dollars in millions
Year ended March 31 Year ended
1998 1999 2000 March 31, 2000
Sales and operating revenue:
Japan . . . . . . . . . . . . . . . . . . . . . . . . . . . . . . . . ¥1,848,023 ¥1,917,028 ¥2,121 ,249 $20,012
U.S.A. . . . . . . . . . . . . . . . . . . . . . . . . . . . . . . . . 2,101,222 2,158,006 2,027,1 29 19,1 24
Europe . . . . . . . . . . . . . . . . . . . . . . . . . . . . . . . 1,568,830 1,667,010 1 ,470,447 13,872
Other . . . . . . . . . . . . . . . . . . . . . . . . . . . . . . . . 1,242,929 1,062,138 1,067,836 1 0,074
Total . . . . . . . . . . . . . . . . . . . . . . . . . . . . . . . ¥6,761,004 ¥6,804,182 ¥6,686,661 $63,082
Yen in millions Dollars in millions
March 31 March 31 ,
1998 1999 2000 2000
Long-lived assets:
Japan . . . . . . . . . . . . . . . . . . . . . . . . . . . . . . . . ¥ 843,800 ¥ 903,345 ¥1 ,321 ,357 $1 2,466
U.S.A. . . . . . . . . . . . . . . . . . . . . . . . . . . . . . . . . 845,887 703,208 61 4,294 5,795
Europe . . . . . . . . . . . . . . . . . . . . . . . . . . . . . . . 192,695 181,621 162,019 1 ,529
Other . . . . . . . . . . . . . . . . . . . . . . . . . . . . . . . . 209,984 143,006 1 31 ,785 1 ,243
Total . . . . . . . . . . . . . . . . . . . . . . . . . . . . . . . ¥2,092,366 ¥1,931,180 ¥2,229,455 $21 ,033
assets for the years ended March 31, 1998, 1999 and
2000 are as follows:
There are not any individually material countries
with respect to the sales and operating revenue and
long-lived assets included in Europe and Other areas.
Transfers between reportable business or geographic
segments are made at arms-length prices.
There are no sales and operating revenue with a
single major external customer for the years ended
March 31, 1998, 1999 and 2000.