Sony 2000 Annual Report Download - page 91
Download and view the complete annual report
Please find page 91 of the 2000 Sony annual report below. You can navigate through the pages in the report by either clicking on the pages listed below, or by using the keyword search tool below to find specific information within the annual report.-
 1
1 -
2
-
3
-
4
-
5
-
6
-
7
-
8
-
9
-
10
-
11
-
12
-
13
-
14
-
15
-
16
-
17
-
18
-
19
-
20
-
21
-
22
-
23
-
24
-
25
-
26
-
27
-
28
-
29
-
30
-
31
-
32
-
33
-
34
-
35
-
36
-
37
-
38
-
39
-
40
-
41
-
42
-
43
-
44
-
45
-
46
-
47
-
48
-
49
-
50
-
51
-
52
-
53
-
54
-
55
-
56
-
57
-
58
-
59
-
60
-
61
-
62
-
63
-
64
-
65
-
66
-
67
-
68
-
69
-
70
-
71
-
72
-
73
-
74
-
75
-
76
-
77
-
78
-
79
-
80
-
 81
81 -
 82
82 -
 83
83 -
 84
84 -
 85
85 -
 86
86 -
 87
87 -
 88
88 -
 89
89 -
 90
90 -
 91
91 -
 92
92 -
 93
93 -
 94
94 -
 95
95 -
 96
96 -
 97
97 -
 98
98 -
 99
99 -
 100
100 -
 101
101 -
102
 |
 |
SONY CORPORATION ANNUAL REPORT 2000
89
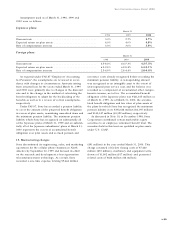
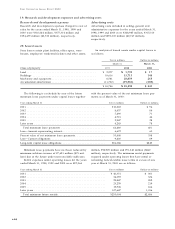
The weighted-average fair value per share at the
date of grant for warrants granted during the years
ended March 31, 1998, 1999 and 2000 was ¥1,009, ¥896
and ¥1,398 ($13), respectively. The fair value of warrants
granted on the date of grant, which is amortized to
expense over the vesting period in determining the pro
forma impact, is estimated using the Black-Scholes
option-pricing model with the following weighted-
average assumptions:
Year ended March 31
1998 1999 2000
Risk-free interest rate . . . . . . . . . . . . . . . . . . . . . . . . . . . . 1.15% 0.80% 0.60%
Expected lives. . . . . . . . . . . . . . . . . . . . . . . . . . . . . . . . . . 2.78 years 2.78 years 2.78 years
Expected volatility. . . . . . . . . . . . . . . . . . . . . . . . . . . . . . . 28.35% 24.42% 33.12%
Expected dividend . . . . . . . . . . . . . . . . . . . . . . . . . . . . . . 0.46% 0.46% 0.40%
SAR plan
Sony adopted separate SAR plans in Japan, Europe and
the United States of America for selected employees.
Under the terms of these plans, employees on exercise
receive cash equal to the amount that the market price
of Sony Corporation’s common stock exceeds the strike
price of the SARs. The SARs generally vest ratably over
a period of three years, and are generally exercisable up
to six years from the date of grant. Sony holds treasury
stock for the SAR plan in Japan to minimize cash flow
exposure associated with the SARs. In addition, Sony
uses various strategies to minimize the compensation
expense associated with certain SAR plans in the United
States of America and Europe.
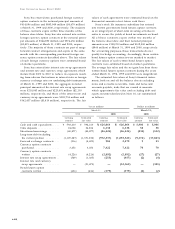
The status of the SAR plans is summarized as follows:
Year ended March 31
1998 1999 2000
Weighted- Weighted- Weighted-
Number of average Number of average Number of average
SARs exercise price SARs exercise price SARs exercise price
Yen Yen Yen Dollars
Outstanding at beginning
of year . . . . . . . . . . . . . — — 484,400 ¥6,106 2,1 90,750 ¥5,426 $51 .19
Granted . . . . . . . . . . . . . 484,400 ¥6,106 1,725,850 5,234 2,306,610 5,896 55.62
Exercised . . . . . . . . . . . . — — — — (439,736) 5,308 50.08
Expired or forfeited . . . . . — — (19,500) 5,275 (11,134) 5,502 51 .91
Outstanding at end
of year . . . . . . . . . . . . . 484,400 ¥6,106 2,190,750 ¥5,426 4,046,490 ¥5,443 $51 .35
Exercisable at end
of year . . . . . . . . . . . . . — — — — 745,496 ¥5,71 1 $53.88
In accordance with APB 25 and its related interpreta-
tions, SAR compensation expense is recognized over
the vesting period as the excess of the quoted market
price of Sony Corporation’s common stock over the
SARs strike price, which is consistent with the
accounting treatment prescribed for SAR plans in FAS
123. For the years ended March 31, 1998, 1999 and
2000, Sony recognized ¥0 million, ¥886 million and
¥19,174 million ($181 million) of SAR compensation
expense, respectively.
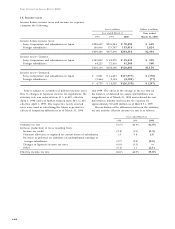
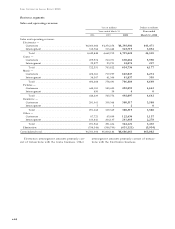
Outstanding Exercisable
Weighted- Weighted- Weighted-
Number of average average Number of average
Exercise price range SARs exercise price remaining life SARs exercise price
Yen Yen Dollars Years Yen Dollars
¥3,1 94 – 5,000 . . . . . . 952,330 ¥ 4,432 $ 41 .81 4.25 80,964 ¥4,601 $43.41
5,001 – 7,500 . . . . . . 3,086,360 5,736 54.1 1 4.94 664,532 5,846 55.1 5
7,501 –1 3,250 . . . . . . 7,800 12,865 1 21 .37 5.83 — — —
¥3,1 94 –1 3,250 . . . . . . 4,046,490 ¥ 5,443 $ 51.35 4.78 745,496 ¥5,71 1 $53.88
A summary of SARs outstanding and exercisable at
March 31, 2000 is as follows: