Sony 2000 Annual Report Download - page 51
Download and view the complete annual report
Please find page 51 of the 2000 Sony annual report below. You can navigate through the pages in the report by either clicking on the pages listed below, or by using the keyword search tool below to find specific information within the annual report.-
 1
1 -
2
-
3
-
4
-
5
-
6
-
7
-
8
-
9
-
10
-
11
-
12
-
13
-
14
-
15
-
16
-
17
-
18
-
19
-
20
-
21
-
22
-
23
-
24
-
25
-
26
-
27
-
28
-
29
-
30
-
31
-
32
-
33
-
34
-
35
-
36
-
37
-
38
-
39
-
40
-
 41
41 -
 42
42 -
 43
43 -
 44
44 -
 45
45 -
 46
46 -
 47
47 -
 48
48 -
 49
49 -
 50
50 -
 51
51 -
 52
52 -
 53
53 -
 54
54 -
 55
55 -
 56
56 -
 57
57 -
 58
58 -
 59
59 -
 60
60 -
 61
61 -
62
-
63
-
64
-
65
-
66
-
67
-
68
-
69
-
70
-
71
-
72
-
73
-
74
-
75
-
76
-
77
-
78
-
79
-
80
-
81
-
82
-
83
-
84
-
85
-
86
-
87
-
88
-
89
-
90
-
91
-
92
-
93
-
94
-
95
-
96
-
97
-
98
-
99
-
100
-
101
-
102
 |
 |

SONY CORPORATION ANNUAL REPORT 2000
49
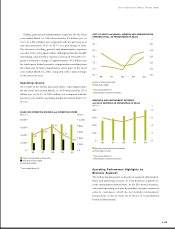
Results in the Game business were significantly negatively
impacted by the yen’s appreciation. On a local currency ba-
sis, sales for the fiscal year ended March 31, 2000 decreased
approximately 6% and operating income decreased approxi-
mately 5% compared with the previous year.
Also, SCE established PlayStation.com (Japan) Inc., with a
view towards direct sales through the Internet as well as fu-
ture distribution services via PlayStation 2, planned to begin
in 2001, of content such as games, music, and pictures. The
newly established company began its service in February 2000,
and in March 2000 allocated newly issued shares to twelve
third parties including Seven-Eleven Japan Co., Ltd.
slightly, profit performance improved. The decrease in sales
was principally due to decreases in sales of creative goods
and magazines at certain subsidiaries, although sales of SMEJ
itself increased due to the success of certain albums, the
releases of which were postponed from the previous year to
this year. As a result, the overall profit performance of the
Music business in Japan improved.
Results in the Music business were significantly negatively
impacted by the yen’s appreciation. On a local currency ba-
sis, sales for the fiscal year ended March 31, 2000 increased
approximately 3% and operating income decreased approxi-
mately 14% compared with the previous year.
Regarding digital music distribution services, in Decem-
ber 1999, SMEJ started in Japan a fee-based music content
distribution service in compliance with SDMI (Secure Digital
Music Initiative), a forum with the aim of protecting copy-
rights of digital music content. In addition, SMEI started a
similar kind of service in the U.S. in April 2000.
Music
Sales for the fiscal year ended March 31, 2000 decreased by
51.8 billion yen, or 6.8%, to 706.9 billion yen compared with
the previous year. Operating income decreased by 8.2 bil-
lion yen, or 22.4%, to 28.4 billion yen and the operating
margin decreased from 4.8% to 4.0%.
Regarding results of Sony Music Entertainment Inc.
(“SMEI”), the U.S. based operation, sales and profit decreased.
The decrease in sales was principally due to sluggish sales in
Europe and Brazil and the yen’s appreciation, although sales
reached record levels in the U.S. Regarding profit perfor-
mance, profit decreased due to the decrease in sales and the
inclusion in the previous year of a one-time license contract
fee for direct marketing results that did not reoccur as well
as expenses for the year incurred in advancing SMEI’s digital
media initiatives. Regarding results of the Music business in
Japan, comprised of Sony Music Entertainment (Japan) Inc.
(“SMEJ”) and its subsidiaries, although overall sales decreased
0
200
400
600
800
0
100
200
300
400
0099989796
13.6%
16.2% 17.4%
11.8%
(4.4%)
SALES and OPERATING INCOME (LOSS) IN GAME BUSINESS
Billion ¥ Billion ¥
Sales (left)
Operating income (loss) (right)
Operating margin
*Year ended March 31
Pictures
Sales for the fiscal year ended March 31, 2000 decreased by
53.7 billion yen, or 9.8%, to 492.1 billion yen compared with
the previous year. Operating income decreased by 4.3 bil-
lion yen, or 10.1%, to 38.6 billion yen and the operating
margin decreased from 7.9% to 7.8%.
The decreases in sales and profit were primarily due to
the yen’s appreciation. In the Motion Picture group, although
several theatrical releases recorded losses, several other films
contributed to box-office revenues, and home video rev-
enues increased, particularly from DVD format unit sales. In
the Television group, international pay television revenues
increased and new licensing revenues for television programs
favorably impacted sales.
0
200
400
600
800
0
50
100
150
200
0099989796
6.4% 6.7% 7.5%
4.8% 4.0%
SALES and OPERATING INCOME IN MUSIC BUSINESS
Billion ¥ Billion ¥
Sales (left)
Operating income (right)
Operating margin
*Year ended March 31