Sony 2000 Annual Report Download - page 48
Download and view the complete annual report
Please find page 48 of the 2000 Sony annual report below. You can navigate through the pages in the report by either clicking on the pages listed below, or by using the keyword search tool below to find specific information within the annual report.-
 1
1 -
2
-
3
-
4
-
5
-
6
-
7
-
8
-
9
-
10
-
11
-
12
-
13
-
14
-
15
-
16
-
17
-
18
-
19
-
20
-
21
-
22
-
23
-
24
-
25
-
26
-
27
-
28
-
29
-
30
-
31
-
32
-
33
-
34
-
35
-
36
-
37
-
 38
38 -
 39
39 -
 40
40 -
 41
41 -
 42
42 -
 43
43 -
 44
44 -
 45
45 -
 46
46 -
 47
47 -
 48
48 -
 49
49 -
 50
50 -
 51
51 -
 52
52 -
 53
53 -
 54
54 -
 55
55 -
 56
56 -
 57
57 -
 58
58 -
59
-
60
-
61
-
62
-
63
-
64
-
65
-
66
-
67
-
68
-
69
-
70
-
71
-
72
-
73
-
74
-
75
-
76
-
77
-
78
-
79
-
80
-
81
-
82
-
83
-
84
-
85
-
86
-
87
-
88
-
89
-
90
-
91
-
92
-
93
-
94
-
95
-
96
-
97
-
98
-
99
-
100
-
101
-
102
 |
 |

SONY CORPORATION ANNUAL REPORT 2000
46
Electronics
Sales for the fiscal year ended March 31, 2000 increased by
49.9 billion yen, or 1.1%, to 4,719.6 billion yen compared
with the previous year. Operating income decreased by 12.5
billion yen, or 9.5%, to 118.6 billion yen and the operating
margin decreased from 2.8% to 2.5%. During the year, de-
spite strong demand in various product categories, the sales
increase was limited to a low level and operating income
decreased, principally due to the yen’s appreciation. Regard-
ing sales by area, sales increased in Japan, where demand
relating to information and communication areas was favor-
Business segment information
Yea r ended Ma rch 31
Percent change
Yen in billions Percent on a local
1999 2000 change currency basis
SALES AND OPERATING REVENUE
Electronics . . . . . . . . . . . . . . . . . . . . . . . . . . . . . . . . . ¥4,669.7 ¥4,719.6 +1.1% +13%
Game . . . . . . . . . . . . . . . . . . . . . . . . . . . . . . . . . . . . 783.8 654.7 –16.5 –6
Music . . . . . . . . . . . . . . . . . . . . . . . . . . . . . . . . . . . . 758.7 706.9 –6.8 +3
Pictures . . . . . . . . . . . . . . . . . . . . . . . . . . . . . . . . . . . 545.8 492.1 –9.8 +3
Insurance . . . . . . . . . . . . . . . . . . . . . . . . . . . . . . . . . 339.4 380.3 +12.1 –
Other . . . . . . . . . . . . . . . . . . . . . . . . . . . . . . . . . . . . 291.6 364.1 +24.9 –
Elimination . . . . . . . . . . . . . . . . . . . . . . . . . . . . . . . . (584.8) (631.1) ––
Consolidated . . . . . . . . . . . . . . . . . . . . . . . . . . . . . . . . . ¥6,804.2 ¥6,686.7 –1.7% +9%
OPERATING INCOME (LOSS)
Electronics . . . . . . . . . . . . . . . . . . . . . . . . . . . . . . . . . ¥ 131.1 ¥ 118.6 –9.5% +132%
Game . . . . . . . . . . . . . . . . . . . . . . . . . . . . . . . . . . . . 136.5 77.4 –43.3 –5
Music . . . . . . . . . . . . . . . . . . . . . . . . . . . . . . . . . . . . 36.6 28.4 –22.4 –14
Pictures . . . . . . . . . . . . . . . . . . . . . . . . . . . . . . . . . . . 43.0 38.6 –10.1 +3
Insurance . . . . . . . . . . . . . . . . . . . . . . . . . . . . . . . . . 18.0 20.9 +16.0 –
Other . . . . . . . . . . . . . . . . . . . . . . . . . . . . . . . . . . . . (4.5) (12.9) ––
Elimination and
Unallocated corporate expenses . . . . . . . . . . . . . . . (12.4) (30.3) ––
Consolidated . . . . . . . . . . . . . . . . . . . . . . . . . . . . . . . . . ¥ 348.2 ¥ 240.6 –30.9% +39%
able, and also increased in Asia, where economies showed a
recovery trend. Sales decreased in the U.S. due to the weak-
ness of the dollar against the yen and also decreased in Eu-
rope due to the substantial depreciation of the euro against
the yen. Sales decreased in South America where economies
continued to be sluggish. The decrease in operating income
was due to an increase in the cost of sales while the sales
increase was limited to a low level as a result of the yen’s
appreciation.
0
1
2
3
4
5
0
100
200
300
400
500
0099989796
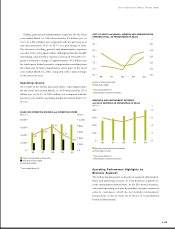
5.6% 5.8% 6.8%
2.8% 2.5%
SALES and OPERATING INCOME IN ELECTRONICS BUSINESS
Trillion ¥ Billion ¥
Sales (left)
Operating income (right)
Operating margin
*Year ended March 31
SHARE OF SALES AND OPERATING REVENUE and
OPERATING INCOME BY BUSINESS SEGMENT
%
Electronics
Game
Music
Pictures
Insurance
Other
Outside: Sales and operating revenue
Inside: Operating income
42
27
10
14
7
64
9
10
7
55
*Year ended March 31, 2000
*Including intersegment transactions
*Operating profit charts are calculated as if operating loss in other segment
were 0.