Sony 2000 Annual Report Download - page 95
Download and view the complete annual report
Please find page 95 of the 2000 Sony annual report below. You can navigate through the pages in the report by either clicking on the pages listed below, or by using the keyword search tool below to find specific information within the annual report.-
 1
1 -
2
-
3
-
4
-
5
-
6
-
7
-
8
-
9
-
10
-
11
-
12
-
13
-
14
-
15
-
16
-
17
-
18
-
19
-
20
-
21
-
22
-
23
-
24
-
25
-
26
-
27
-
28
-
29
-
30
-
31
-
32
-
33
-
34
-
35
-
36
-
37
-
38
-
39
-
40
-
41
-
42
-
43
-
44
-
45
-
46
-
47
-
48
-
49
-
50
-
51
-
52
-
53
-
54
-
55
-
56
-
57
-
58
-
59
-
60
-
61
-
62
-
63
-
64
-
65
-
66
-
67
-
68
-
69
-
70
-
71
-
72
-
73
-
74
-
75
-
76
-
77
-
78
-
79
-
80
-
81
-
82
-
83
-
84
-
 85
85 -
 86
86 -
 87
87 -
 88
88 -
 89
89 -
 90
90 -
 91
91 -
 92
92 -
 93
93 -
 94
94 -
 95
95 -
 96
96 -
 97
97 -
 98
98 -
 99
99 -
 100
100 -
 101
101 -
 102
102
 |
 |

SONY CORPORATION ANNUAL REPORT 2000
93
Segment profit or loss:
Yen in millions Dollars in millions
Year ended March 31 Year ended
1998 1999 2000 March 31 , 2000
Operating income (loss):
Electronics. . . . . . . . . . . . . . . . . . . . . . . . . . . . . . ¥ 317,276 ¥ 131,106 ¥ 1 1 8,629 $ 1 ,1 1 9
Game . . . . . . . . . . . . . . . . . . . . . . . . . . . . . . . . . 116,936 136,500 77,352 730
Music . . . . . . . . . . . . . . . . . . . . . . . . . . . . . . . . . 52,058 36,566 28,357 268
Pictures . . . . . . . . . . . . . . . . . . . . . . . . . . . . . . . . 37,013 42,954 38,61 6 364
Insurance . . . . . . . . . . . . . . . . . . . . . . . . . . . . . . 20,326 18,048 20,929 1 97
Other . . . . . . . . . . . . . . . . . . . . . . . . . . . . . . . . . (6,959) (4,538) (1 2,945) (1 22)
Total . . . . . . . . . . . . . . . . . . . . . . . . . . . . . . . . 536,650 360,636 270,938 2,556
Elimination . . . . . . . . . . . . . . . . . . . . . . . . . . . . . 10,749 10,313 1 0,387 98
Unallocated amounts: Corporate expenses . . . . . . (21,675) (22,737) (40,698) (384)
Consolidated operating income . . . . . . . . . . . . . . . . 525,724 348,212 240,627 2,270
Other income . . . . . . . . . . . . . . . . . . . . . . . . . . . . . 83,963 152,905 1 48,848 1 ,404
Other expenses . . . . . . . . . . . . . . . . . . . . . . . . . . . . (150,424) (123,426) (1 25,165) (1,1 81)
Consolidated income before income taxes . . . . . . . . ¥ 459,263 ¥ 377,691 ¥ 264,31 0 $ 2,493
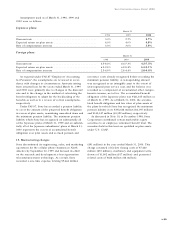
Operating income is sales and operating revenue
less costs and operating expenses. The increase in
unallocated corporate expenses in the year ended
March 31, 2000 was primarily due to an increase in
stock-based compensation expenses.
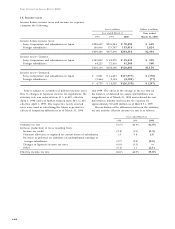
Assets:
Yen in millions Dollars in millions
March 31 March 31 ,
1998 1999 2000 2000
Total assets:
Electronics. . . . . . . . . . . . . . . . . . . . . . . . . . . . . . ¥3,253,990 ¥3,058,355 ¥3,074,917 $29,009
Game . . . . . . . . . . . . . . . . . . . . . . . . . . . . . . . . . 197,605 188,796 446,085 4,208
Music . . . . . . . . . . . . . . . . . . . . . . . . . . . . . . . . . 835,939 755,765 742,678 7,006
Pictures . . . . . . . . . . . . . . . . . . . . . . . . . . . . . . . . 915,545 836,134 805,762 7,602
Insurance . . . . . . . . . . . . . . . . . . . . . . . . . . . . . . 899,016 1,129,005 1 ,383,71 7 13,054
Other . . . . . . . . . . . . . . . . . . . . . . . . . . . . . . . . . 309,150 388,497 474,354 4,475
Total . . . . . . . . . . . . . . . . . . . . . . . . . . . . . . . . 6,411,245 6,356,552 6,927,513 65,354
Elimination . . . . . . . . . . . . . . . . . . . . . . . . . . . . . (221,112) (215,732) (273,51 4) (2,580)
Corporate assets . . . . . . . . . . . . . . . . . . . . . . . . . 212,910 158,233 1 53,1 98 1 ,445
Consolidated total . . . . . . . . . . . . . . . . . . . . . . . . . . ¥6,403,043 ¥6,299,053 ¥6,807,1 97 $64,21 9
Unallocated corporate assets consist primarily of
cash and cash equivalents and marketable securities
maintained for general corporate purposes.