Sony 2000 Annual Report Download - page 47
Download and view the complete annual report
Please find page 47 of the 2000 Sony annual report below. You can navigate through the pages in the report by either clicking on the pages listed below, or by using the keyword search tool below to find specific information within the annual report.-
 1
1 -
2
-
3
-
4
-
5
-
6
-
7
-
8
-
9
-
10
-
11
-
12
-
13
-
14
-
15
-
16
-
17
-
18
-
19
-
20
-
21
-
22
-
23
-
24
-
25
-
26
-
27
-
28
-
29
-
30
-
31
-
32
-
33
-
34
-
35
-
36
-
 37
37 -
 38
38 -
 39
39 -
 40
40 -
 41
41 -
 42
42 -
 43
43 -
 44
44 -
 45
45 -
 46
46 -
 47
47 -
 48
48 -
 49
49 -
 50
50 -
 51
51 -
 52
52 -
 53
53 -
 54
54 -
 55
55 -
 56
56 -
 57
57 -
58
-
59
-
60
-
61
-
62
-
63
-
64
-
65
-
66
-
67
-
68
-
69
-
70
-
71
-
72
-
73
-
74
-
75
-
76
-
77
-
78
-
79
-
80
-
81
-
82
-
83
-
84
-
85
-
86
-
87
-
88
-
89
-
90
-
91
-
92
-
93
-
94
-
95
-
96
-
97
-
98
-
99
-
100
-
101
-
102
 |
 |
SONY CORPORATION ANNUAL REPORT 2000
45
Selling, general and administrative expenses for the fiscal
year ended March 31, 2000 decreased by 9.3 billion yen, or
0.6%, to 1,491.6 billion yen compared with the previous year
and increased from 23.2% to 23.7% as a percentage of sales.
The decrease of selling, general and administrative expenses
was due to the yen’s appreciation, although personnel, freight,
advertising, and royalties expenses increased. Personnel ex-
penses included a charge of approximately 19.2 billion yen
for stock-price linked incentive compensation resulting from
the sharp rise in Sony Corporation’s stock price in the fiscal
year ended March 31, 2000, compared with a minor charge
in the previous year.
Operating Income
As a result of the factors discussed above, operating income
for the fiscal year ended March 31, 2000 decreased by 107.6
billion yen, or 30.9%, to 240.6 billion yen compared with the
previous year and the operating margin decreased from 5.1%
to 3.6%.
Operating Performance Highlights by
Business Segment
The following discussion is based on segment information.
Sales and operating revenue in each business segment in-
clude intersegment transactions. In the Electronics business,
sales and operating revenue by product category represent
sales to customers, which do not include intersegment
transactions (refer to Note 22 of Notes to Consolidated
Financial Statements).
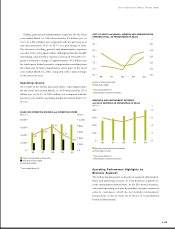
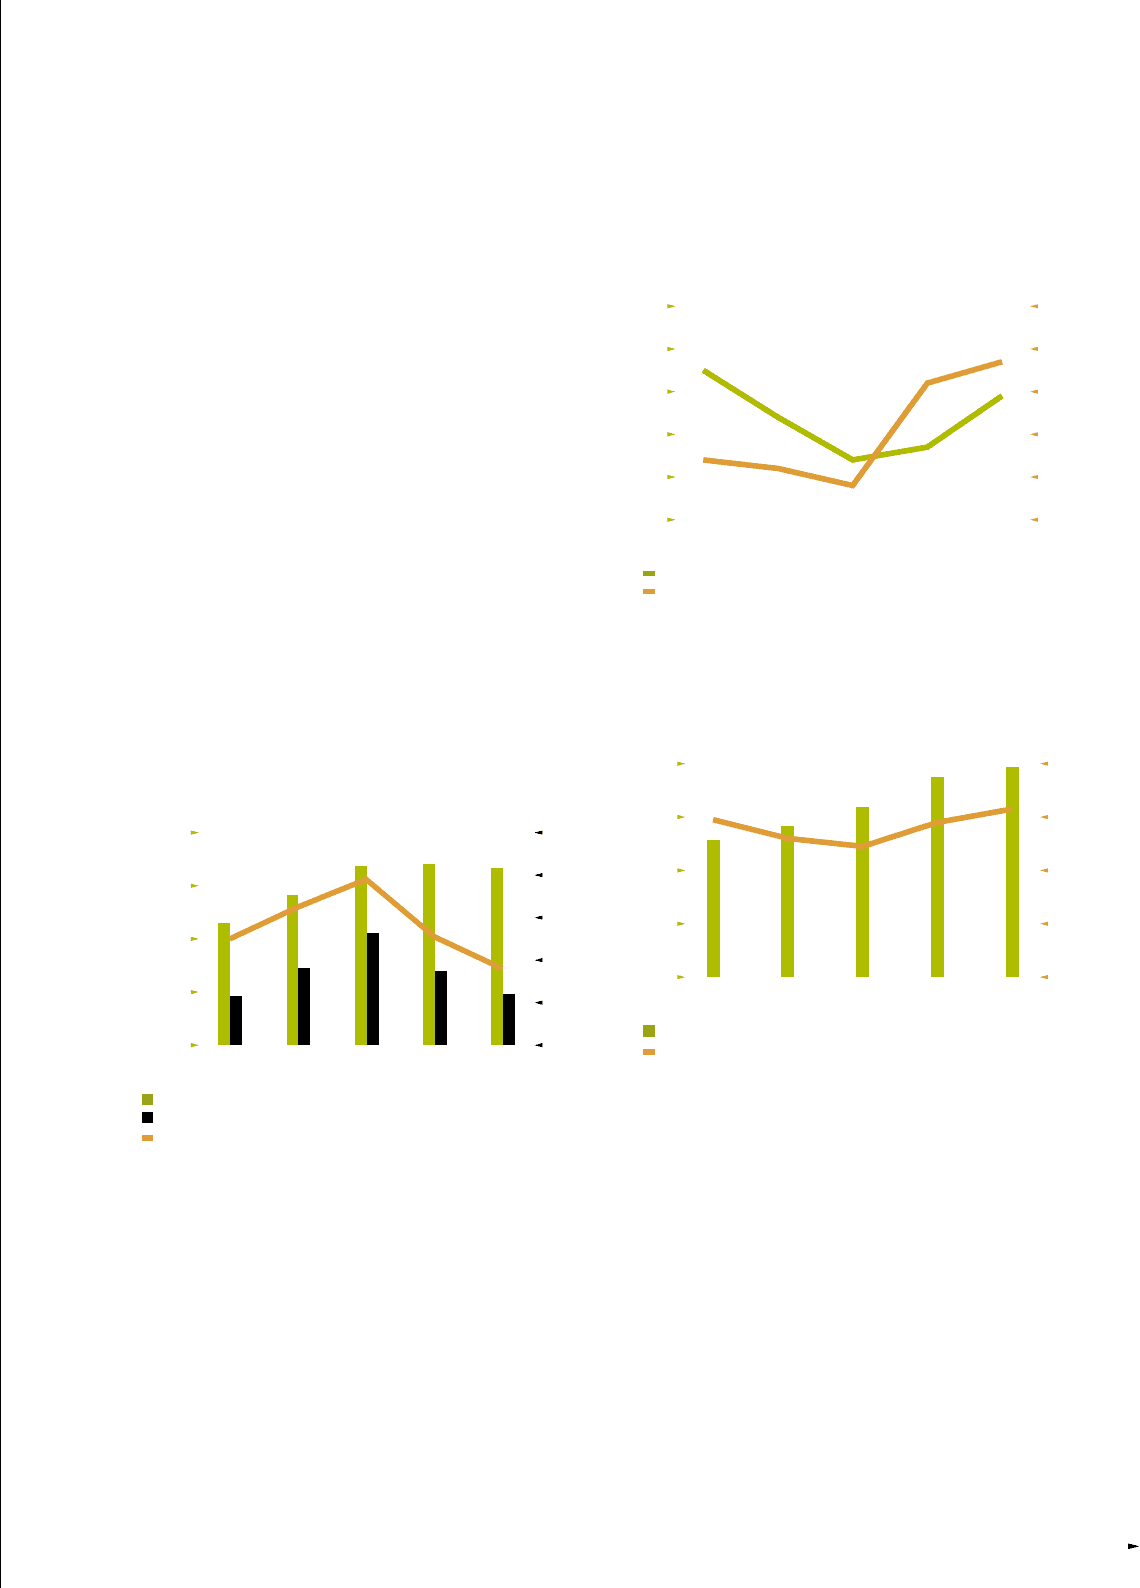
SALES AND OPERATING REVENUE and OPERATING INCOME
Billion ¥ Billion ¥
Sales and operating revenue (left)
Operating income (right)
Operating margin
*Year ended March 31
COST OF SALES and SELLING, GENERAL AND ADMINISTRATIVE
EXPENSES (SGA), AS PERCENTAGES OF SALES
%%
Cost of sales/sales (left)
SGA/sales (right)
*Year ended March 31
*Excluding the Insurance business
0
2,000
4,000
6,000
8,000
0
200
400
600
800
1,000
0099989796
5.0%
6.5%
7.8%
5.1%
3.6%
70
71
72
73
74
75
0099989796 20
21
22
23
24
25
0
100
200
300
400
0099989796 0
2
4
6
8
RESEARCH AND DEVELOPMENT EXPENSES
and SUCH EXPENSES AS PERCENTAGE OF SALES
Billion ¥ %
Research and development expenses
Percentage of sales
*Year ended March 31
*Excluding the Insurance business