Sony 2000 Annual Report Download - page 96
Download and view the complete annual report
Please find page 96 of the 2000 Sony annual report below. You can navigate through the pages in the report by either clicking on the pages listed below, or by using the keyword search tool below to find specific information within the annual report.-
 1
1 -
2
-
3
-
4
-
5
-
6
-
7
-
8
-
9
-
10
-
11
-
12
-
13
-
14
-
15
-
16
-
17
-
18
-
19
-
20
-
21
-
22
-
23
-
24
-
25
-
26
-
27
-
28
-
29
-
30
-
31
-
32
-
33
-
34
-
35
-
36
-
37
-
38
-
39
-
40
-
41
-
42
-
43
-
44
-
45
-
46
-
47
-
48
-
49
-
50
-
51
-
52
-
53
-
54
-
55
-
56
-
57
-
58
-
59
-
60
-
61
-
62
-
63
-
64
-
65
-
66
-
67
-
68
-
69
-
70
-
71
-
72
-
73
-
74
-
75
-
76
-
77
-
78
-
79
-
80
-
81
-
82
-
83
-
84
-
85
-
 86
86 -
 87
87 -
 88
88 -
 89
89 -
 90
90 -
 91
91 -
 92
92 -
 93
93 -
 94
94 -
 95
95 -
 96
96 -
 97
97 -
 98
98 -
 99
99 -
 100
100 -
 101
101 -
 102
102
 |
 |

94
SONY CORPORATION ANNUAL REPORT 2000
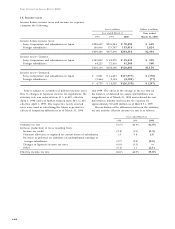
Other significant items:
Yen in millions Dollars in millions
Year ended March 31 Year ended
1998 1999 2000 March 31, 2000
Depreciation and amortization:
Electronics. . . . . . . . . . . . . . . . . . . . . . . . . . . . . ¥197,449 ¥218,608 ¥212,275 $2,003
Game . . . . . . . . . . . . . . . . . . . . . . . . . . . . . . . . 12,536 3,895 1 3,414 1 26
Music . . . . . . . . . . . . . . . . . . . . . . . . . . . . . . . . 30,933 34,523 32,807 309
Pictures . . . . . . . . . . . . . . . . . . . . . . . . . . . . . . . 16,668 11,329 10,468 99
Insurance, including deferred insurance
acquisition costs . . . . . . . . . . . . . . . . . . . . . . . 22,410 21,085 23,699 224
Other . . . . . . . . . . . . . . . . . . . . . . . . . . . . . . . . 17,539 15,402 10,797 102
Total . . . . . . . . . . . . . . . . . . . . . . . . . . . . . . . 297,535 304,842 303,460 2,863
Corporate . . . . . . . . . . . . . . . . . . . . . . . . . . . . . 4,130 2,331 3,045 29
Consolidated total . . . . . . . . . . . . . . . . . . . . . . . . . ¥301,665 ¥307,173 ¥306,505 $2,892
Capital expenditures for segment assets:
Electronics. . . . . . . . . . . . . . . . . . . . . . . . . . . . . ¥301,197 ¥252,363 ¥227,322 $2,145
Game . . . . . . . . . . . . . . . . . . . . . . . . . . . . . . . . 17,114 3,941 1 1 8,960 1,122
Music . . . . . . . . . . . . . . . . . . . . . . . . . . . . . . . . 28,361 45,222 24,644 232
Pictures . . . . . . . . . . . . . . . . . . . . . . . . . . . . . . . 13,477 10,747 11 ,293 1 07
Insurance . . . . . . . . . . . . . . . . . . . . . . . . . . . . . 633 836 2,979 28
Other . . . . . . . . . . . . . . . . . . . . . . . . . . . . . . . . 24,102 36,574 48,455 457
Total . . . . . . . . . . . . . . . . . . . . . . . . . . . . . . . 384,884 349,683 433,653 4,091
Corporate . . . . . . . . . . . . . . . . . . . . . . . . . . . . . 3,071 4,047 2,234 21
Consolidated total . . . . . . . . . . . . . . . . . . . . . . . . . ¥387,955 ¥353,730 ¥435,887 $4,1 12
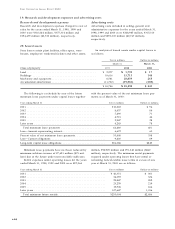
Yen in millions Dollars in millions
Year ended March 31 Year ended
1998 1999 2000 March 31, 2000
Audio . . . . . . . . . . . . . . . . . . . . . . . . . . . . . . . . . . ¥1,127,788 ¥1,072,621 ¥ 934,865 $ 8,820
Video . . . . . . . . . . . . . . . . . . . . . . . . . . . . . . . . . . 870,854 969,129 976,705 9,21 4
Televisions . . . . . . . . . . . . . . . . . . . . . . . . . . . . . . 709,043 702,620 71 4,1 88 6,738
Information and Communications . . . . . . . . . . . . . 894,810 914,140 1,052,707 9,931
Electronic components and other . . . . . . . . . . . . . 777,589 697,744 71 7,441 6,768
Total . . . . . . . . . . . . . . . . . . . . . . . . . . . . . . . ¥4,380,084 ¥4,356,254 ¥4,395,906 $41,471
The capital expenditures in the above table represent
the additions to fixed assets of each segment.
The following table is a breakdown of Electronics
sales and operating revenue to external customers by
product category. The Electronics business is managed
as a single operating segment by Sony’s management.