Sony 2000 Annual Report Download - page 94
Download and view the complete annual report
Please find page 94 of the 2000 Sony annual report below. You can navigate through the pages in the report by either clicking on the pages listed below, or by using the keyword search tool below to find specific information within the annual report.-
 1
1 -
2
-
3
-
4
-
5
-
6
-
7
-
8
-
9
-
10
-
11
-
12
-
13
-
14
-
15
-
16
-
17
-
18
-
19
-
20
-
21
-
22
-
23
-
24
-
25
-
26
-
27
-
28
-
29
-
30
-
31
-
32
-
33
-
34
-
35
-
36
-
37
-
38
-
39
-
40
-
41
-
42
-
43
-
44
-
45
-
46
-
47
-
48
-
49
-
50
-
51
-
52
-
53
-
54
-
55
-
56
-
57
-
58
-
59
-
60
-
61
-
62
-
63
-
64
-
65
-
66
-
67
-
68
-
69
-
70
-
71
-
72
-
73
-
74
-
75
-
76
-
77
-
78
-
79
-
80
-
81
-
82
-
83
-
 84
84 -
 85
85 -
 86
86 -
 87
87 -
 88
88 -
 89
89 -
 90
90 -
 91
91 -
 92
92 -
 93
93 -
 94
94 -
 95
95 -
 96
96 -
 97
97 -
 98
98 -
 99
99 -
 100
100 -
 101
101 -
 102
102
 |
 |

92
SONY CORPORATION ANNUAL REPORT 2000
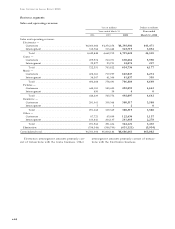
Business segments
Sales and operating revenue:
Yen in millions Dollars in millions
Year ended March 31 Year ended
1998 1999 2000 March 31 , 2000
Sales and operating revenue:
Electronics —
Customers . . . . . . . . . . . . . . . . . . . . . . . . . . . ¥4,380,084 ¥4,356,254 ¥4,395,906 $41 ,471
Intersegment . . . . . . . . . . . . . . . . . . . . . . . . . 312,764 313,448 323,71 9 3,054
Total . . . . . . . . . . . . . . . . . . . . . . . . . . . . . 4,692,848 4,669,702 4,719,625 44,525
Game —
Customers . . . . . . . . . . . . . . . . . . . . . . . . . . . 699,574 760,071 630,662 5,950
Intersegment . . . . . . . . . . . . . . . . . . . . . . . . . 22,977 23,751 24,074 227
Total . . . . . . . . . . . . . . . . . . . . . . . . . . . . . 722,551 783,822 654,736 6,1 77
Music —
Customers . . . . . . . . . . . . . . . . . . . . . . . . . . . 658,381 717,297 665,047 6,274
Intersegment . . . . . . . . . . . . . . . . . . . . . . . . . 34,307 41,394 41 ,837 395
Total . . . . . . . . . . . . . . . . . . . . . . . . . . . . . 692,688 758,691 706,884 6,669
Pictures —
Customers . . . . . . . . . . . . . . . . . . . . . . . . . . . 644,183 545,693 492,093 4,642
Intersegment . . . . . . . . . . . . . . . . . . . . . . . . . 450 59 40
Total . . . . . . . . . . . . . . . . . . . . . . . . . . . . . 644,633 545,752 492,097 4,642
Insurance —
Customers . . . . . . . . . . . . . . . . . . . . . . . . . . . 291,061 339,368 380,31 7 3,588
Intersegment . . . . . . . . . . . . . . . . . . . . . . . . . 7 1 20
Total . . . . . . . . . . . . . . . . . . . . . . . . . . . . . 291,068 339,369 380,31 9 3,588
Other —
Customers . . . . . . . . . . . . . . . . . . . . . . . . . . . 87,721 85,499 122,636 1 ,157
Intersegment . . . . . . . . . . . . . . . . . . . . . . . . . 163,841 206,137 241,485 2,278
Total . . . . . . . . . . . . . . . . . . . . . . . . . . . . . 251,562 291,636 364,1 21 3,435
Elimination . . . . . . . . . . . . . . . . . . . . . . . . . . . . (534,346) (584,790) (631,121 ) (5,954)
Consolidated total . . . . . . . . . . . . . . . . . . . . . . . . . ¥6,761,004 ¥6,804,182 ¥6,686,661 $63,082
Electronics intersegment amounts primarily con-
sist of transactions with the Game business. Other
intersegment amounts primarily consist of transac-
tions with the Electronics business.